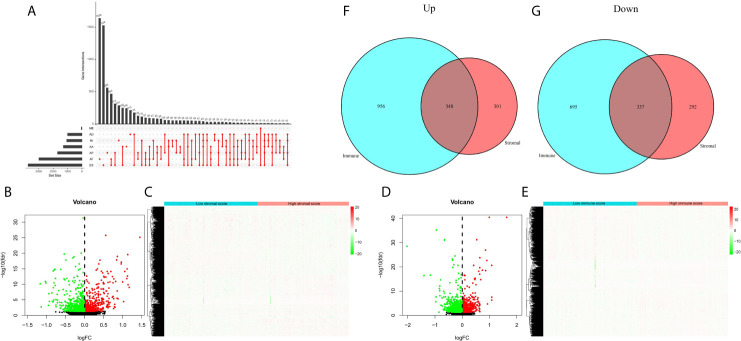
Figure 3.
DEAS events between high and low stromal/immune scores groups. (A) The UpSet plot of intersections between AS events and the corresponding gene intersections. The volcano plots (B, D) and heatmaps (C, E) of DEAS events between the high and low stromal/immune scores groups. The up-regulated (F) or down-regulated (G) DEAS events in both stromal score and immune scores groups by Venn diagram.

