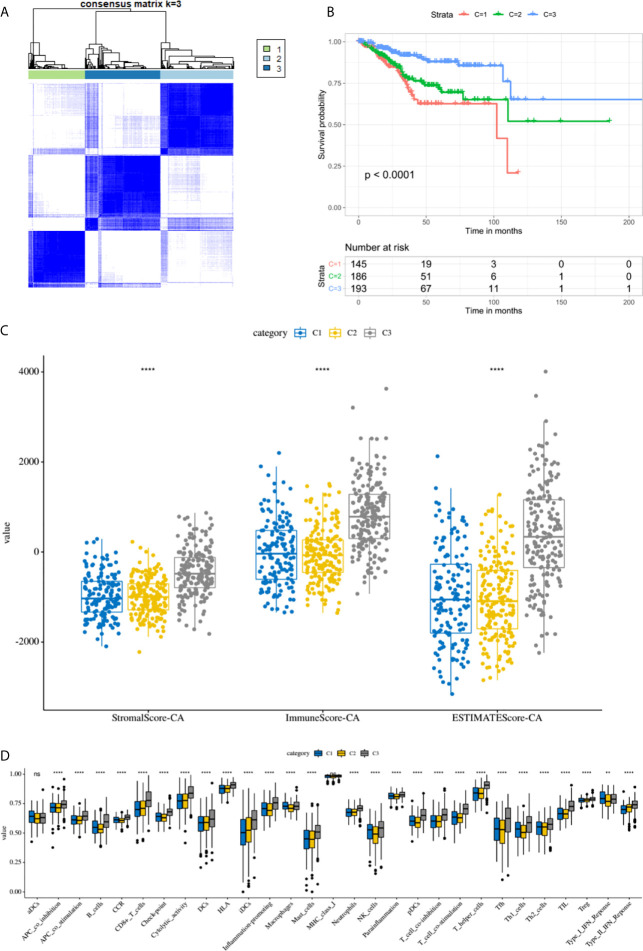
Figure 7.
The immune microenvironment was closely related to the prognosis of EC patients. (A) TCGA EC cohort was clustered into three subgroups by unsupervised cluster analysis. (B) K-M survival curves of three clusters. (C) The comparison of stromal scores, immune scores, and ESTIMATE scores between three clusters. (D) Box plots for comparison of immune cell infiltration between three clusters. ****, P < 0.0001; NS, not significant.

