FIGURE 2.
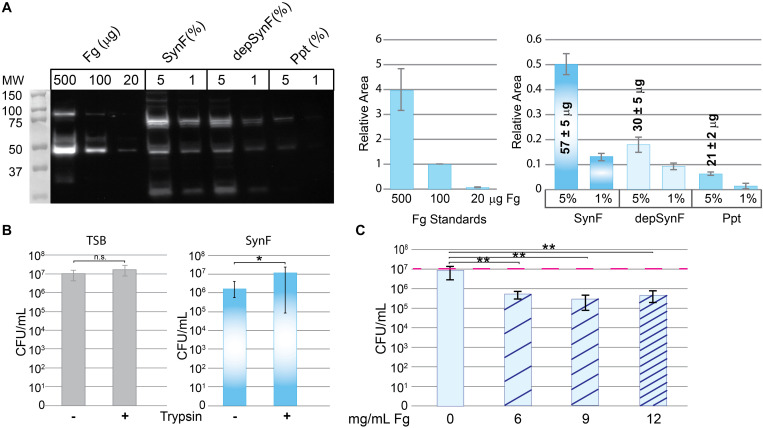
Effects of fibrinogen (Fg) on aggregation. (A) Western blot showing Fg standards, amount of Fg detected in pooled human synovial fluid (equal amounts added; percentage of synovial fluid in solution indicated), and amount remaining in synovial fluid after ethanol depletion of proteins including Fg (depSynF) and amount in the Fg-enriched precipitate (ppt) (>3 blots with similar results). Densitometry of this Western blot is shown on the right using varying exposures. Fg standards are plotted in the first graph and used to calculate Fg contained in the 5% samples. Areas associated with the experimental Fg samples were determined and normalized to the 100-μg sample. (B) Effects of aggregation in pooled synovial fluid on colony-forming units (CFUs)/ml. Minus indicates no dispersion and reflects counts obtained by dilution and counting. Plus indicates the counts after treatment of the cultures with trypsin to disperse aggregates. Values graphed are means ± SD {*p ≤ 0.05; n = 9 [Trypticase Soy Broth (TSB)], 12–13 (Synovial fluid)}. (C) Re-addition of Fg to depSynF causes reacquisition of aggregation at 90 min, as demonstrated by decreased CFU/ml. Red dashed line indicates the initial inoculum. Values graphed are means ± SD (*p ≤ 0.05; **p ≤ 0.01; n = 6 for each condition; representative experiment of three with similar results for each).

