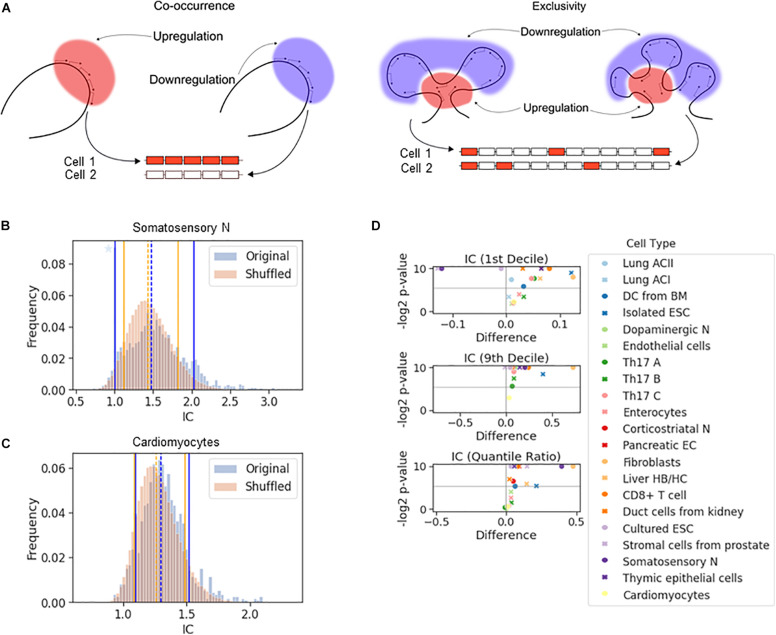
FIGURE 2.
The effect of chromosomal adjacency on stochastic gene choice. (A) Schemes showing examples of how the two major forms of stochastic gene choice, concurrence and exclusivity, can arise from alternative chromosomal configurations. (B,C) The IC distributions calculated from the original and the shuffled genomes of the somatosensory neurons (B) and cardiomyocytes (C). Segmentation size: 14 genes. The blue star denotes a high bar in the histogram hidden by the full line. The location of the 1st (full line), 5th (dashed line) and 9th (full line) deciles is given in the order of original and reshuffled distribution, followed by the P-values for the differences: 1.00, 1.48, 2.02; 1.12, 1.44, 1.82; 0.001, 0.016, 0.001. (B) 1.10, 1.29, 1.52; 1.09, 1.26, 1.49; 0.217, 0.002, 0.137 (C). (D) Volcano plots showing the difference of 1st decile, 9th decile and quantile ratio IC values between the original and the shuffled genomes, along with the corresponding P-values (permutation test, segment size: 14 genes). The gray horizontal line at 0.025 corresponds to a two-tailed significance level of 0.05.

