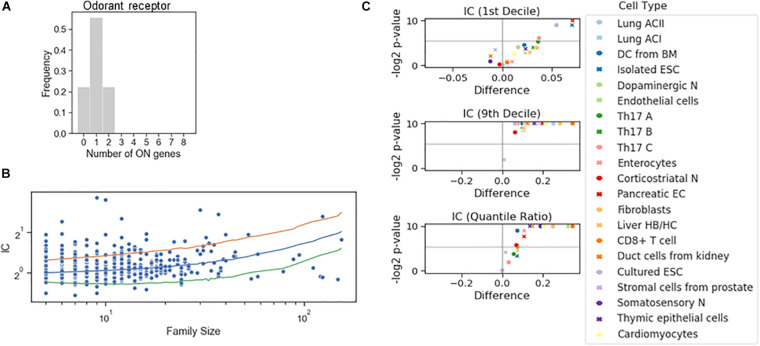
FIGURE 4.
Stochastic interdependence in gene families. (A) The number of expressed genes per cell in the family of odorant receptor genes, dichotomized with the familywise threshold (70.7 TPM). Number of cells is N = 27. (B) IC values of individual families in somatosensory neuron dataset, grouped by the family size. The majority of the families with ICs exceeding either 2.5 or 97.5 IC percentiles of the shuffled genome (orange and green lines, respectively) are concurrent. (C) Volcano plots showing the difference of 1st decile, 9th decile and quantile Ratio IC values between the original and the shuffled genomes, along with the corresponding P-values (permutation test) calculated for the gene families consisting of 7 genes.

