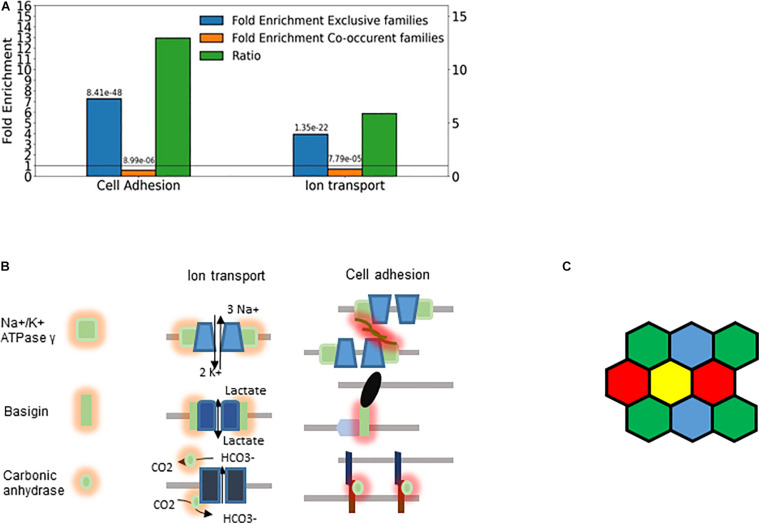
FIGURE 8.
Cellular individuality and cell adhesion. (A) Enrichment analysis of the genes belonging to exclusive and concurrent gene families. The P-values are indicated on the top of the bars. The exclusive families were selected with the criteria described in Figures 4B, 7. The concurrent families (IC belonging to top 2.5 percentile) were constrained with the following criteria: mean number of expressed genes per cell higher than 0.03, IC significantly higher than 1 and at least 5 non-zero genes per family. We considered all the genes expressed at least in one cell type belonging to the selected families. The enrichment analysis was performed though an enrichment analysis tool (http://geneontology.org/). The figure shows two selected functions: Cell adhesion (GO: 0007155) and Ion transport (GO: 0006811). The ratio of the fold-enrichment in the exclusive to that in concurrent families is shown. (B) Schematic representation highlighting the dual role of three gene families (Fxyd, basigin, and carbonic anhydrase genes). On the left side, the cis interaction of the corresponding proteins with channels and pumps is denoted by orange shades. These functions are related to metabolic and ion homeostasis. On the right side, the trans-interaction with ligands on the adjacent cells is labeled with red shades. The glycosylation of the Fxyd protein affects the transdimerization of the Na+/K+ ATPase. The carbonic anhydrase interacts with the anion exchange protein, which transports HCO3–. (C) Schematic representation of cells showing that the exclusive expression of four gene isoforms (colors) is sufficient to confer cellular individuality in a two dimensional tissue.

