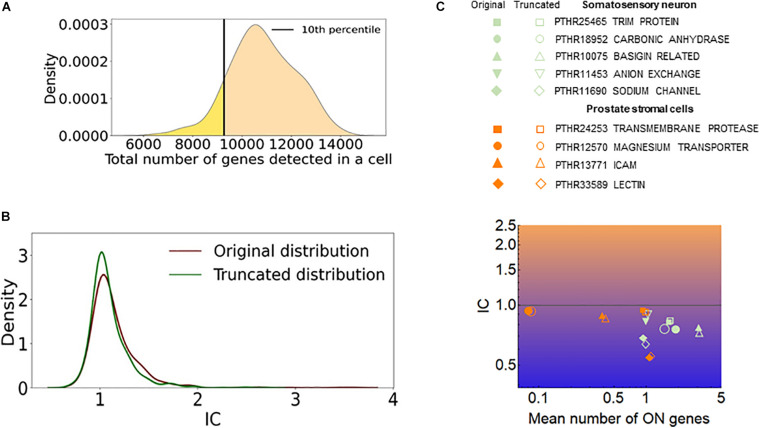
FIGURE 9.
The effect of cells with low number of detected genes on the IC. (A) The distribution of the total number of detected genes per cell (dgpc) in the somatosensory neuron dataset. The black line indicates the dgpc below which the cells were removed to obtain the truncated distribution. (B) The distribution of IC values of gene families calculated from the original and truncated cell populations shown in (A). (C) The IC and the mean number of ON genes calculated with the original (full) and the truncated (empty) datasets. The prostate stromal cell and the somatosensory neuron datasets were used.

