FIGURE 1.
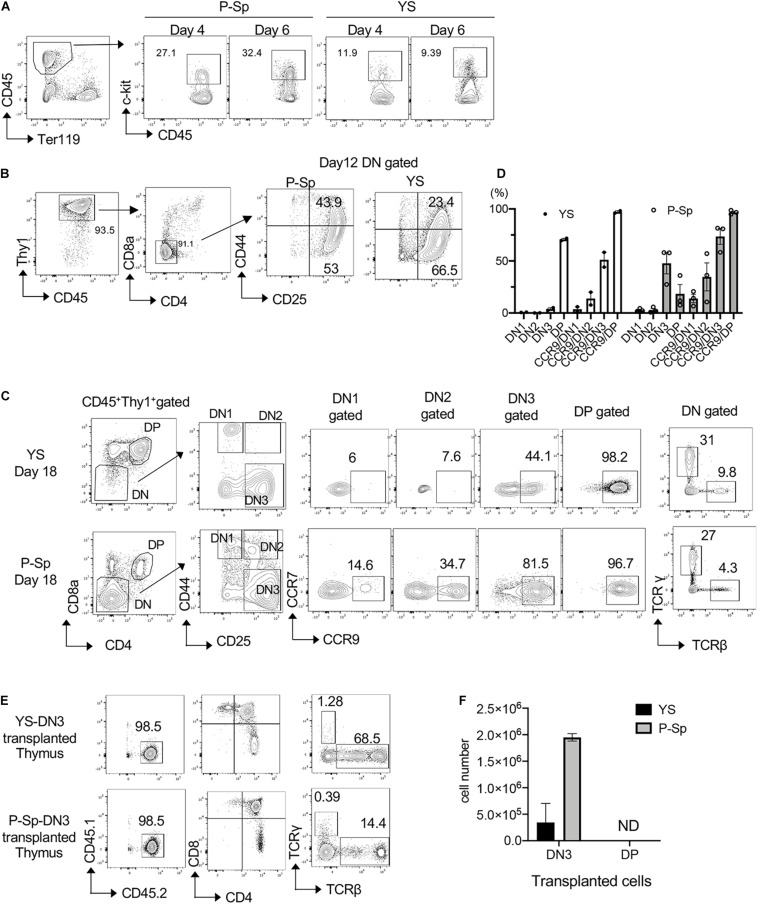
Induction of DN2 phenotype by NICD transduction. (A) E9.5 YS and P-Sp were cultured on DL1-OP9, and CD45+c-kit+ hematopoietic progenitors were measured on different time points, one of the three independent experiments shown. (B) Representative FACS plots showing DN phenotype on day 12 of YS and P-Sp co-culture on OP9-DL1. (C) CCR9 expression in each DN populations of YS and P-Sp cells co-cultured with DL1-OP9 for 18 days. One of the three independent experiments is depicted. TCRβ and TCRγ expressions in DN cells were also confirmed. (D) The percentage of DN stages and CCR9+ cells in each DN population of YS and P-Sp co-culture with OP9DL1, depicted in panel (C). Thymus engraftment of DN3 cells from YS- and P-Sp co-culture with OP9-DL1 cells (E) and their repopulated cell numbers in the recipient thymus (F).

