FIGURE 3.
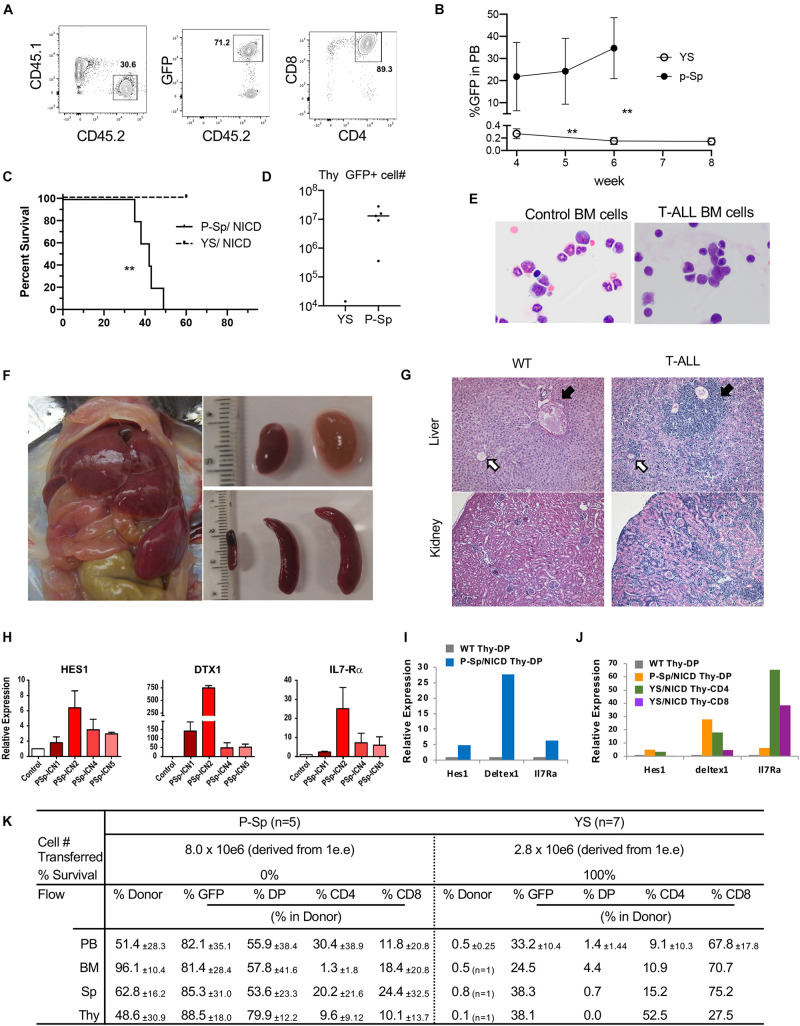
Leukemia propagation by the cultured P-Sp-NICD, not YS-NICD. (A) Representative dot plots of recipient PB repopulated with P-Sp-NICD at 6 weeks after transplantation. (B) Percentage of GFP+CD45.2 cells in recipient PB are plotted (n = 5–7, **P < 0.01). (C) Survival curve are depicted (**P < 0.01). (D) Thymus engraftment by P-Sp-derived NICD-GFP+ T-ALL cells. (E) May–Giemsa staining of ctr BM cells and recipient BM cells with P-Sp-NICD are shown. (F) Liver, spleen, and kidney are markedly enlarged. (G) Upper panel: liver, leukemic cells infiltrate in the portal area and around central vein as well as in the liver sinusoids. Black arrow: portal area, white arrow: central vein. Lower panel: kidney, leukemic cell infiltration was observed. (H–J) Upregulations of Notch targets in leukemic cells were measured by qPCR. Each RNA from recipient spleen were applied and compared to normal BM cells (H). Those targets in leukemic thymic DP cells were compared to normal thymus DP cells (I). Small populations of GFP+NICD-YS-derived CD4+ or CD8+ T-cells were sorted and evaluated for Notch targets (J). (K) P-Sp- and YS-derived cells engrafted in the recipient organs including PB, BM, spleen, and thymus.

