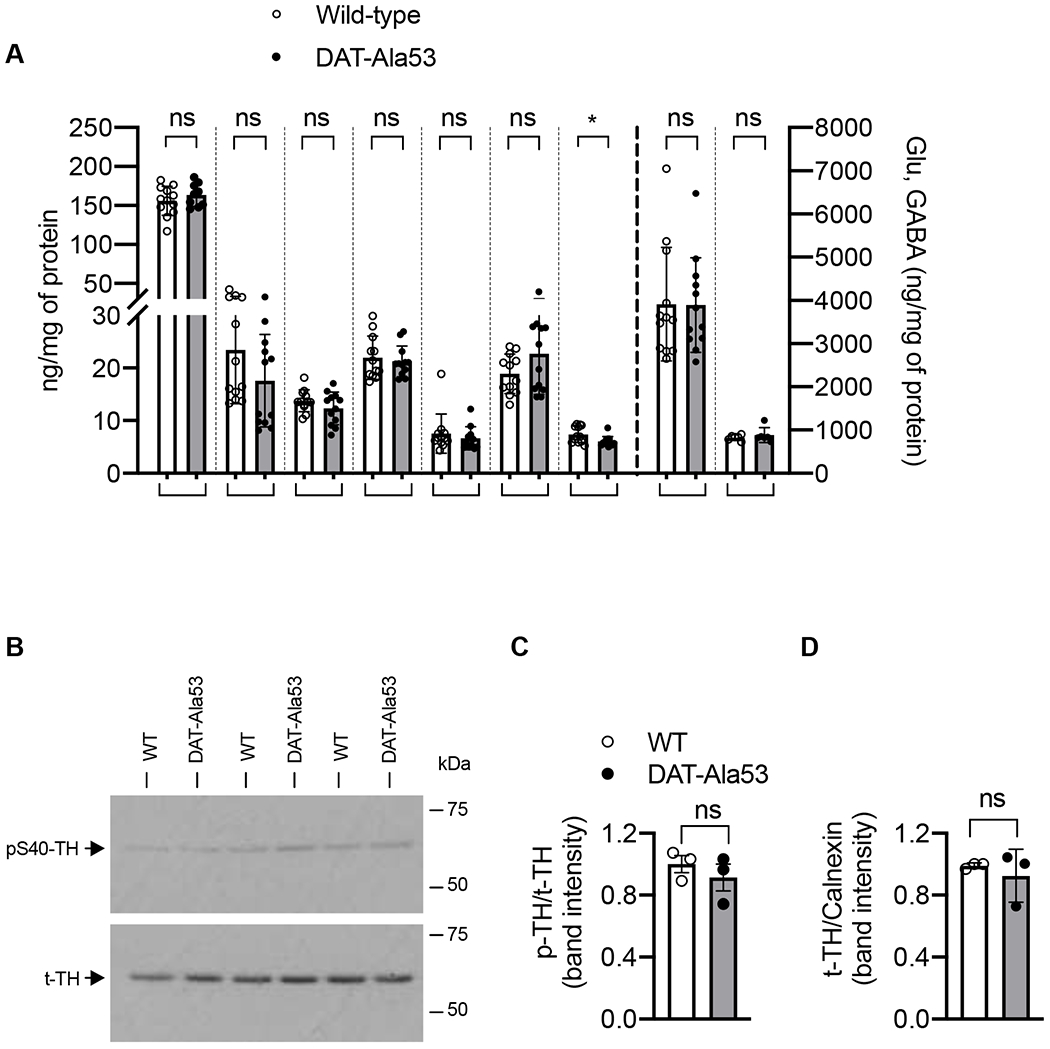
Fig. 4. Neurotransmitter levels and expression of t-TH andp-TH in DAT-Ala53 striatum.

(A) The concentrations of DA, DOPAC, 3-MT, HVA, NE, 5-HT, 5-HIAA, Glu and GABA in the WT and DAT-Ala53 striatal tissues. Values are presented as Mean ± S.D. DAT-Ala53 (n = 12) and WT (n = 12). * P = 0.0175 and ns: nonsignificant compared to WT (unpaired two-tailed Student’s t-test). (B) Representative immunoblots show expression of p-TH (~60 kDa) and t-TH (~60 kDa). (C) Quantified p-TH normalized to t-TH and (D) quantified t-TH normalized to total calnexin (~90 kDa). Values are presented as Mean ± S.D. DAT-Ala53 (n = 3) and WT (n = 3) ns: nonsignificant (unpaired two-tailed Student’s t-test). DA: dopamine, DOPAC: 3,4-dihydroxyphenylacetic acid, 3-MT: 3-methoxytyramine, HVA: homovanillic acid, NE: norepinephrine, 5-HT: 5-hydroxytryptamine (serotonin), 5-HIAA: 5-hydroxyindoleacetic acid, Glu: glutamate, GABA: gamma aminobutyric acid.
