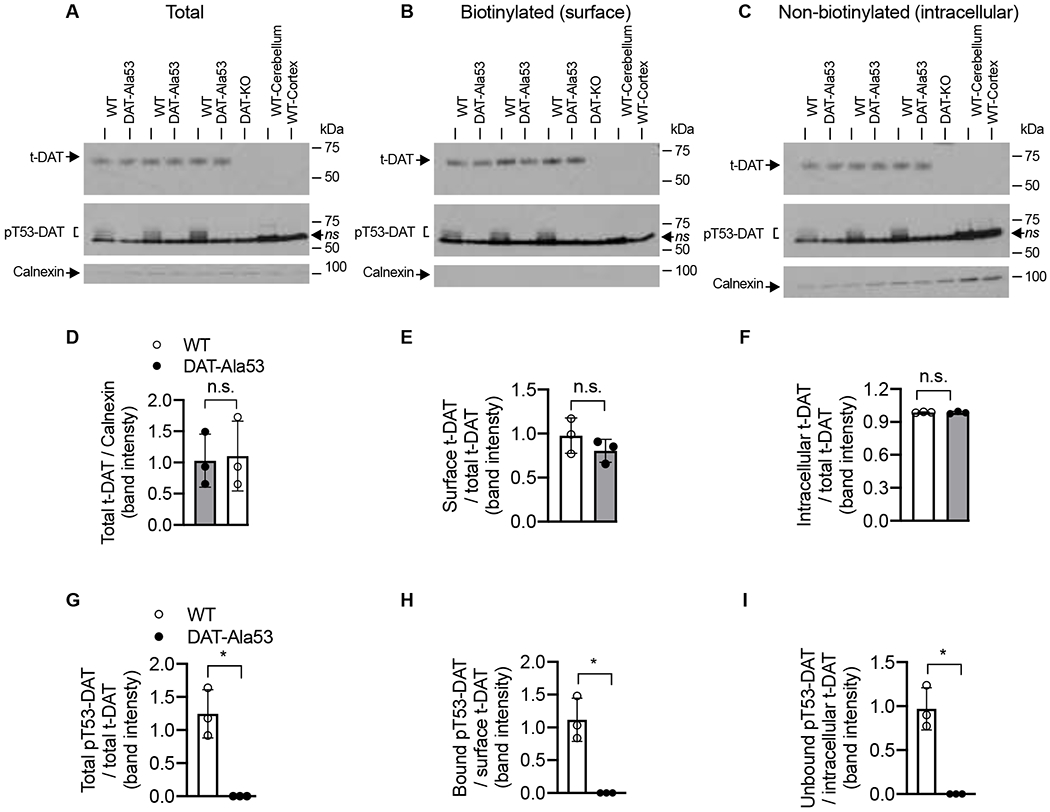
Fig. 7. Similar total and cell surface expression of DAT in the striatal synaptosomes of DAT-Ala53 mice.

Surface protein biotinylation, immunoblotting, and quantification were done as described in material and methods section 2.9. Representative immunoblots (A, B, C) show total, biotinylated and non-biotinylated t-DAT (~65 kDa) and pT53-DAT (~60-55 kDa). The intracellular calnexin bands (~90 kDa) were shown under each respective blot. In parallel, protein extracts from DAT-KO striatum or lysates of cerebellum and cortex (without the frontal cortex) from WT were used to validate the specificity of t-DAT and pT53-DAT bands. Quantified t-DAT band intensities are as shown. (D) total extract normalized to total calnexin, (E) biotinylated surface fraction normalized to total t-DAT, and (F) non-biotinylated intracellular fraction normalized to total t-DAT. Quantified pT53-DAT band intensities are as shown. (G) total extract normalized to total t-DAT. (H) biotinylated surface fraction normalized to biotinylated t-DAT, and (I) non-biotinylated intracellular fraction normalized to intracellular t-DAT. Values are presented as Mean ± S.D. WT (n = 3) and DAT-Ala53 (n = 3) mice. * P < 0.05 and ns: nonsignificant (unpaired two-tailed Student’s t-test).
