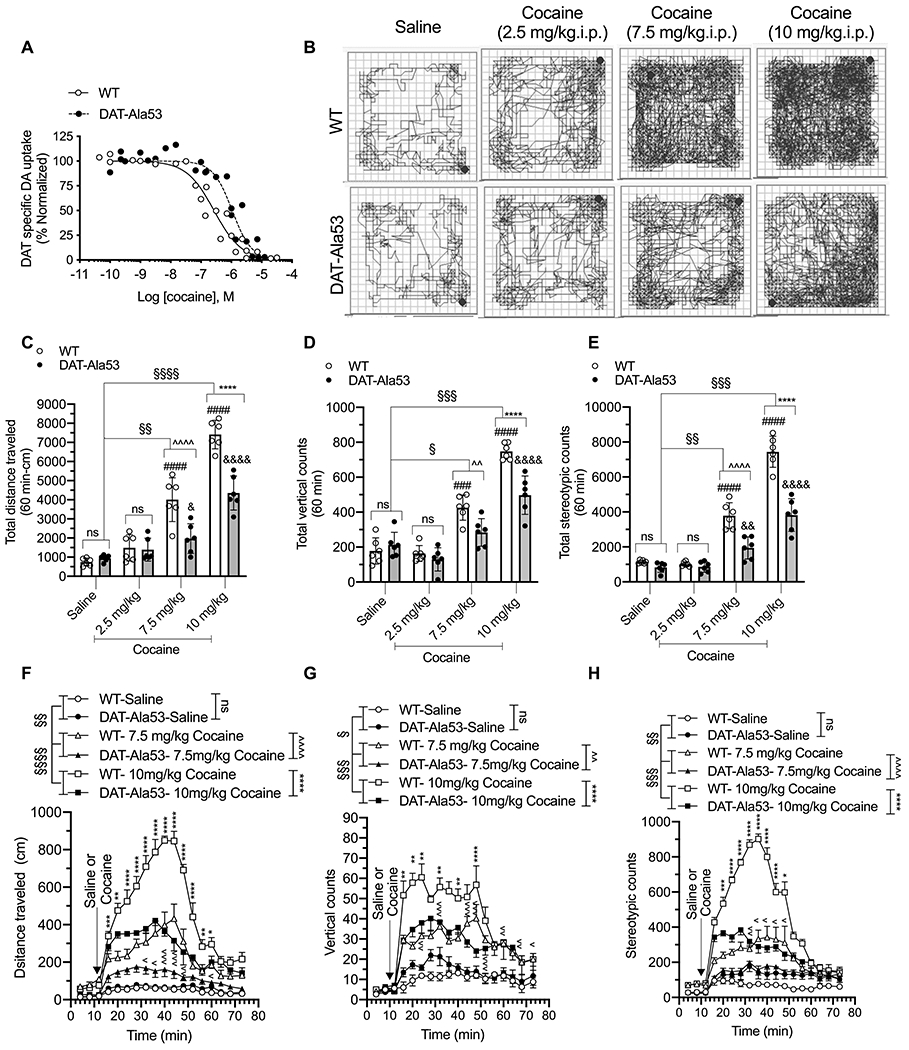
Fig. 9. Reduced cocaine potency and suppression of cocaine induced locomotor activity in DAT-Ala53 mice.

(A) Competition DA uptake assays with cocaine were performed using crude synaptosomes from the striatum of WT and DAT-Ala53 mice. Striatal synaptosomes were incubated with a fixed concentration of [3H] DA (20 nM) and increasing concentrations of cocaine for 4 min as described under material and methods section 2.12. DAT-specific DA uptake was normalized with control uptake in the absence of test compound. Figure shows the normalized data plotted against the log of the molar concentrations of test the compound. IC50 values were determined using nonlinear regression fit. Cocaine IC50 in DAT-Ala53 is significantly shifted to the right compared to WT (P = 0.007 unpaired two-tailed Student’s t-test). WT (n = 3) and DAT-Ala53 (n = 3) mice for each compound. (B - H) Habituated male WT (n = 6 for all groups) and DAT-Ala53 (n = 6 for all groups) animals were injected with saline or cocaine with different doses (2.5 or 7.5 or 10 mg/kg. i.p.) and placed in the locomotor boxes and monitored motor activities for 60 min. Representative activity traces show the locomotor activity of WT and DAT-Ala53 mice post-injection of vehicle or cocaine (B). Comparative analysis (DAT-Ala53 vs. WT) of total distance traveled (C), vertical counts (D), and stereotypy counts (E) are shown. Time course plots show distance traveled, vertical counts, and stereotypy counts measured in 4 min bins over 60 min period post-injection (F, G, H). Bonferroni’s multiple comparison test followed by two-way ANOVA: § P <0.05, §§ P <0.01, §§§ P <0.001, §§§§ P <0.0001, ns: nonsignificant effect (P > 0.9999) compared between specified pairs, Λ P <0.05, ΛΛ P <0.01, ΛΛΛ P <0.001, ΛΛΛ P <0.0001, (WT-cocaine (7.5 mg/kg) versus DAT-Ala53-cocaine (7.5 mg/kg), * P <0.05, ** P <0.01, *** P <0.001, **** P<0.0001, (WT-cocaine (10 mg/kg) versus DAT-Ala53-cocaine (10 mg/kg), ### P <0.001, #### P <0.0001, (WT-saline vs WT-cocaine), & P <0.05, && P <0.001, &&&& P <0.0001(DAT-Ala53-saline vs DAT-Ala53-cocaine). Data are presented as Means ± S.D.
