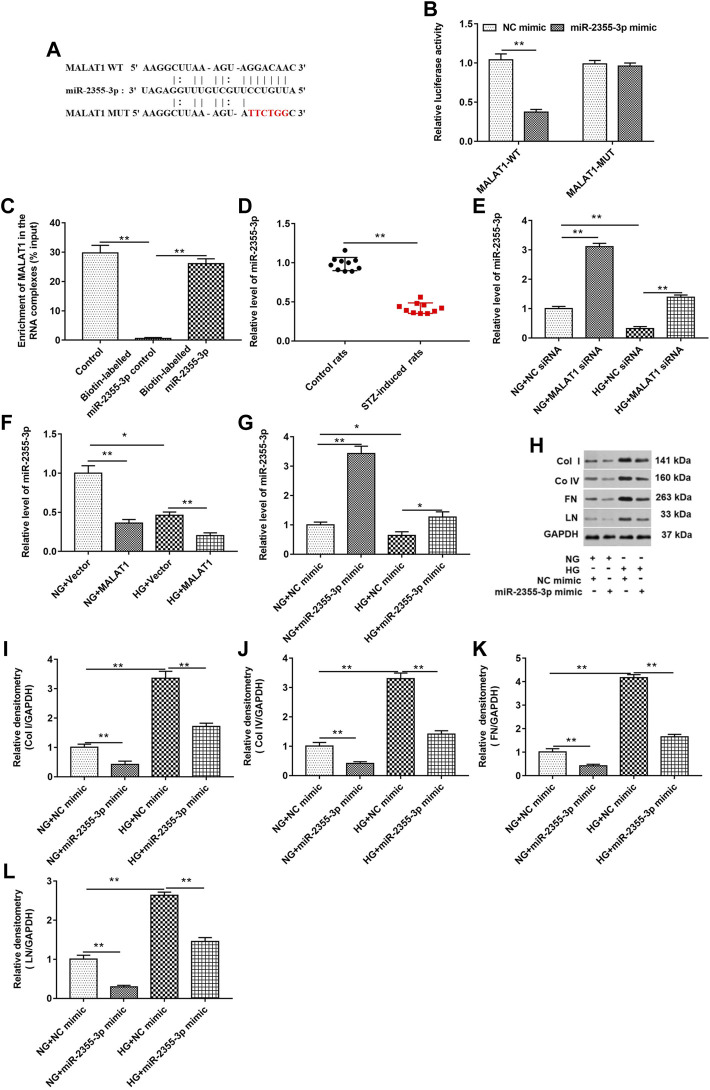
FIGURE 4.
lncRNA MALAT1 directly bound to miR-2355-3p, and overexpression of miR-2355-3p downregulated col I, col IV, FN, and LN protein levels in HG-treated HK-2 cells. (A) StarBase (http://starbase.sysu.edu.cn/) was used to predict the binding between MALAT1 and miR-2355-3p. (B) Luciferase reporter gene assay was used to verify the binding between MALAT1 and miR-2355-3p. **p < 0.01 vs. NC mimic group. (C) Pull-down assay was used to detect the binding ability of miR-2355-3p and lncRNA MALAT1. **p < 0.01 vs. control or biotin-labeled miR-2355-3p group. (D) miR-2355-3p level in STZ-induced diabetic rats (n = 10) and control rats (n = 10) was detected by RT-qPCR. **p < 0.01 vs. control rats. (E and F) miR-2355-3p level was measured with RT-qPCR in NG- or HG-treated cells transfected with MALAT1 siRNA, NC siRNA, pcDNA-MALAT1, or pcDNA3.1. *p < 0.05 vs. NG + vector group, **p < 0.01 vs. NG + NC siRNA group, HG + NC siRNA group, NG + vector group, or HG + vector group. (G) miR-2355-3p level was measured with Western blot assay in NG- or HG-treated cells transfected with miR-2355-3p mimic or NC mimic. *p < 0.05 vs. NG + NC mimic, **p < 0.01 vs. NG + NC mimic group or HG + NC mimic group. (H) Expression of col I, col IV, FN, and LN in NG- or HG-treated cells transfected with miR-2355-3p mimic or NC mimic was detected by Western blotting. The histogram in (I–L) presents the densitometric analysis of the blots (col I, col IV, FN, and LN) normalized to GAPDH. **p < 0.01 vs. NG + NC mimic or HG + NC mimic group.

