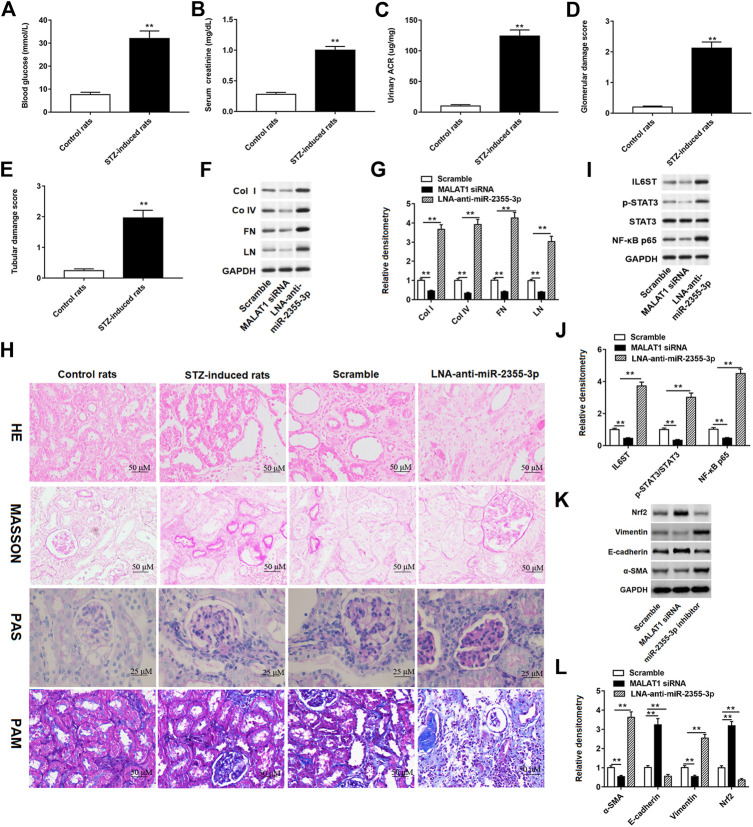
FIGURE 8.
STZ-induced diabetic rats aggravated renal injury and promoted renal fibrosis. Contents of (A) blood glucose, (B) serum creatinine, and (C) urinary ACR were detected by ELISA in STZ-induced diabetic rats (n = 10) and control rats (n = 10). **p < 0.01 vs. control rats. (D and E) Glomerular and tubular damage scores were evaluated by the experimenter. **p < 0.01 vs. control rats. (F) Western blot assay was used to detect the col I, col IV, FN, and LN protein levels in STZ-induced diabetic rats administrated with MALAT1 siRNA or miR-2355-3p inhibitor. The histogram in (G) shows the densitometric analysis of the blots (col I, col IV, FN, and LN) normalized to GAPDH. **p < 0.01 vs. scramble group. (H) Renal tissues of rats were collected for H&E (×200, scale bar = 50 µm), Masson’s trichrome (×200, scale bar = 50 µm), PAS (×400, scale bar = 25 µm), and PAM staining (×200, scale bar = 50 µm). miR-2355-3p levels were measured in heart, liver, bladder, kidney and peritoneal tissues of STZ-induced diabetic rats administrated with LNA-anti-miR-2355-3p and scramble (Supplementary Figure S1). **p < 0.01 vs. scramble group. (I) Western blot assay was used to measure the IL6ST, p-STAT3, total STAT3, and NF-kB p65 protein levels in STZ-induced diabetic rats when rats were administrated with MALAT1 siRNA or LNA-anti-miR-2355-3p. The histogram in (J) presents the densitometric analysis of the blots (IL6ST, p-STAT3/STAT3, and NF-kB p65) normalized to GAPDH. **p < 0.01 vs. scramble group. (K) Several EMT marker protein levels, including Nrf2, vimentin, E-cadherin, and α-SMA, were detected by Western blotting in MALAT1 knockdown or antagomir-treated kidneys. The histogram in (L) shows the densitometric analysis of the blots (α-SMA, E-cadherin, vimentin, and Nrf2) normalized to GAPDH. **p < 0.01 vs. scramble group.

