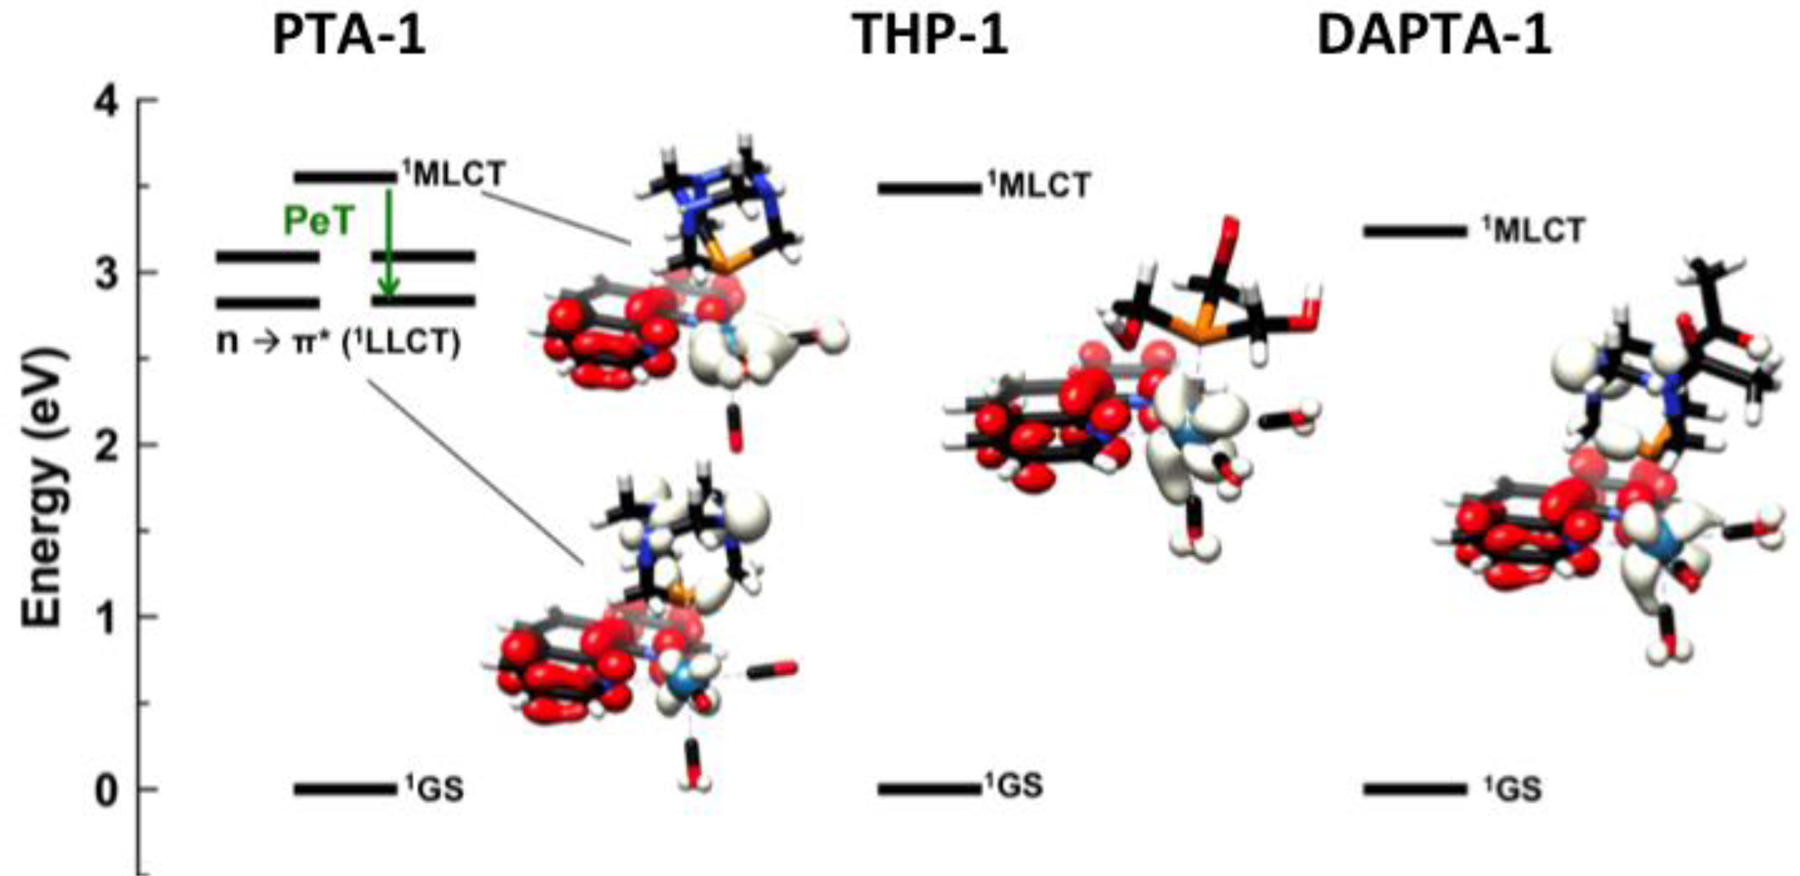
Figure 5.

State energy diagram of PTA-1 (left), THP-1 (middle), and DAPTA-1 (right), and the corresponding electron density difference maps for relevant excited states. Negative (white) and positive (red) electron density illustrates the transitions.
