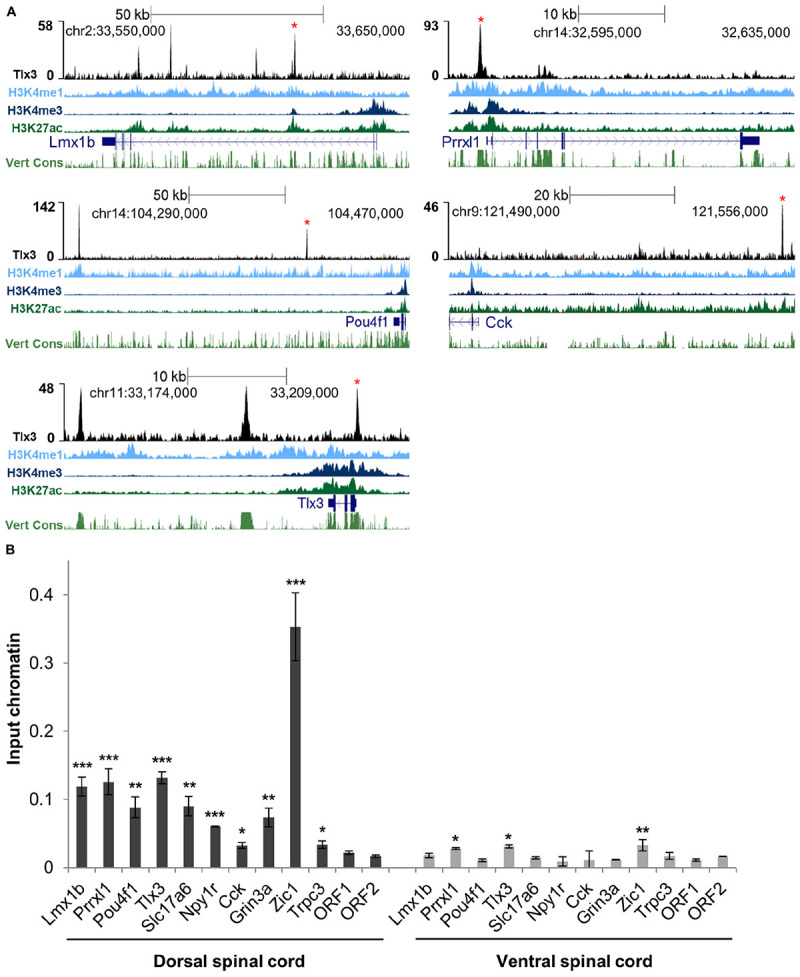
FIGURE 2.

Tlx3 directly controls the expression of transcription factors and terminal differentiation genes involved in glutamatergic differentiation. (A) Tlx3 binding profile (in black) within genomic regions spanning target genes. Target gene structure and direction of transcription (blue), H3K4me1 (light blue), H3K4me3 (blue), and H3K27ac (green), as well as multispecies vertebrate conservation (green) plots are shown. ENCODE annotations are from histone marks of ChIP-seq data sets using E14.5 mouse neural tube (Gorkin et al., 2020). Data tracks extracted using the UCSC genome browser (Waterston et al., 2002). Binding sites validated by ChIP-qPCR are marked by red asterisks. (B) Validation of Tlx3 binding sites by independent ChIP-qPCR using chromatin extracted from either E14.5 dorsal or ventral spinal cords. Two negative control regions (ORF1/2) are shown. Mean ± SD; *P < 0.05, **P < 0.01, and ***P < 0.001 as compared to ORF2 with Student’s t-test; n = 3 experimental replicates.
