FIGURE 3.

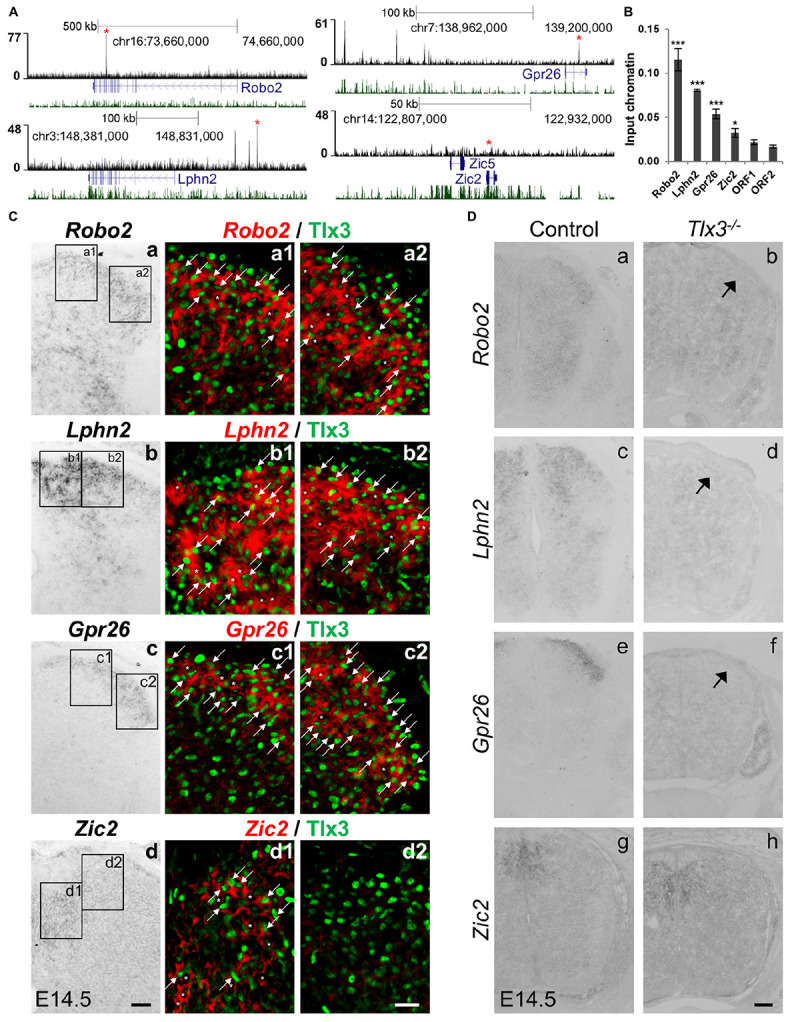
Identification of novel Tlx3 target genes. (A) Tlx3 binding profile (black) within genomic regions spanning target genes. Target gene structure and direction of transcription (blue) as well as multispecies vertebrate conservation plot (green) are shown. Binding sites used for ChIP-qPCR validation are marked by red asterisks. (B) Validation of Tlx3 binding sites by independent ChIP-qPCR using chromatin extracted from E14.5 dorsal spinal cords. Two negative control regions (ORF1/2) are shown. Mean ± SD; *P < 0.05 and ***P < 0.001 as compared to ORF1 with Student’s t-test; n = 3 experimental replicates. (C) Expression of Robo2, Lphn2, Gpr26, and Zic2 in Tlx3+ neurons. a–d In situ hybridizations using transverse sections of lumbar spinal cord of E14.5 wild type embryos. a1–d2 Double staining of Tlx3 protein (a1–2, b1–2, c1–2, d1–2, green) with either Robo2 (a1–2, red), Lphn2 (b1–2, red), Gpr26 (c1–2, red), and Zic2 (d1–2, red) mRNA. Note that bright-field in situ hybridization signals were converted into red pseudocolor signals. Note the extensive co-expression of Robo2, Lphn2, and Gpr26 with Tlx3 (a1–2, b1–2, c1–2, arrows), but little co-expression of Zic2 with Tlx3. Expression of putative target genes in Tlx3– cells is labeled an asterisk. Scale bars: a–d 50 μm; a1–d2 20 μm. (D) Reduction or loss of the expression of target genes in Tlx3 null dorsal spinal cord assessed by in situ hybridization. a–h Transverse sections through the lumbar spinal cord of E14.5 wild type [a (n = 5); c (n = 4); e (n = 6); g (n = 4)] and Tlx3 null mutants [b (n = 3); d (n = 3); f (n = 3); h (n = 3)]. Expression of Robo2, Lphn2, and Gpr26 was markedly reduced (b, d, f, arrow). Zic2 expression was not affected (h), as previously observed (Ding et al., 2004). Scale bar: 100 μm.
