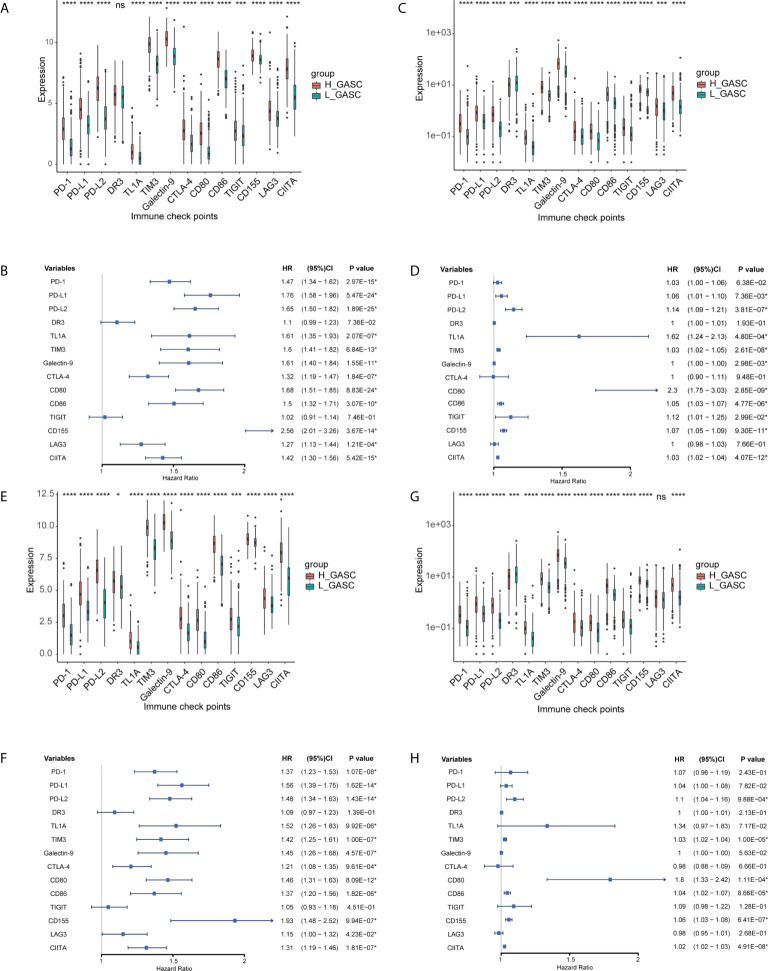
Figure 10.
Associations between GASCs and expression of ICPs. (A, C, E, G) Bar charts illustrating the differences of ICP’ expressions between high- and low-GASC groups in all glioma population (A for TCGA and C for CGGA) and high-grade glioma population (E for TCGA and G for CGGA). (B, D, F, H) Forest plots of univariate Cox regression analysis of ICP’ expressions in all glioma population (B for TCGA and D for CGGA) and high-grade glioma population (F for TCGA and H for CGGA). ns: p > 0.05, *p ≤ 0.05, ***p ≤ 0.001, ****p ≤ 0.0001.

