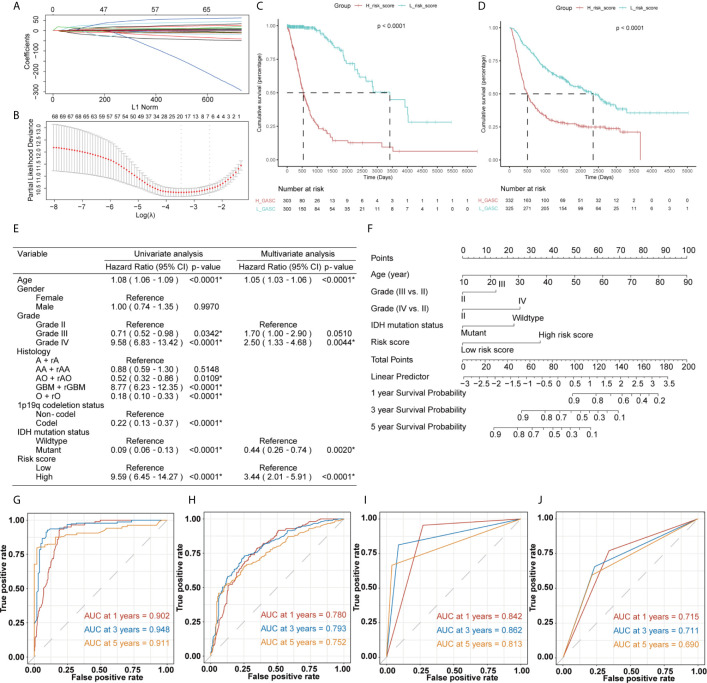
Figure 12.
Construction of the risk score system and establishment and validation of the nomogram survival model. (A, B) LASSO Cox regression analysis of training dataset. (C, D) Kaplan-Meier overall survival (OS) curves for samples in high- and low-risk score groups (C for training dataset and D for validation dataset). (E) Uni- and multi-variate Cox regression analysis for prognostic model. *Statistical significance. (F) The nomogram for predicting 1-, 3‐, or 5‐year OS. (G, H) Time-dependent ROC curves of the nomogram prediction on the 1-, 3-, and 5-year survival rates (G for training dataset and H for validation dataset). (I, J) Time-dependent ROC curves of the IDH mutation status prediction on the 1-, 3-, and 5-year survival rates (I for training dataset and J for validation dataset).

