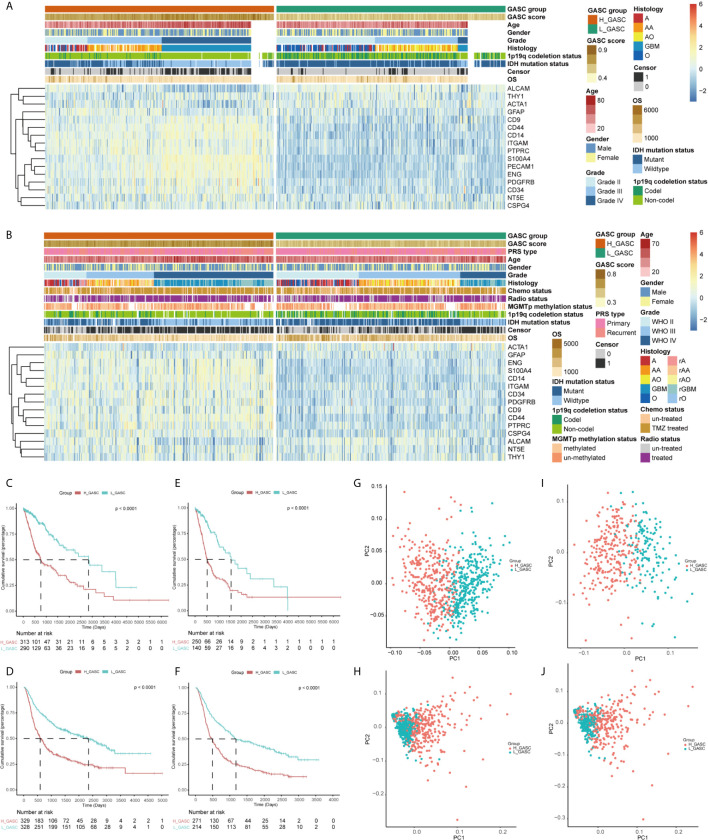
Figure 2.
Identification of high- and low-GASC groups. (A, B) Heatmap of GASC markers in all glioma population (A for TCGA and B for CGGA). (C–F) Kaplan-Meier overall survival (OS) curves for samples in high- and low-GASC groups from all glioma population (C for TCGA and D for CGGA) and high-grade glioma population (E for TCGA and F for CGGA). (G–J) Principal component analysis of high- and low-GASC groups from all glioma population (G for TCGA and H for CGGA) and high-grade glioma population (I for TCGA and J for CGGA).

