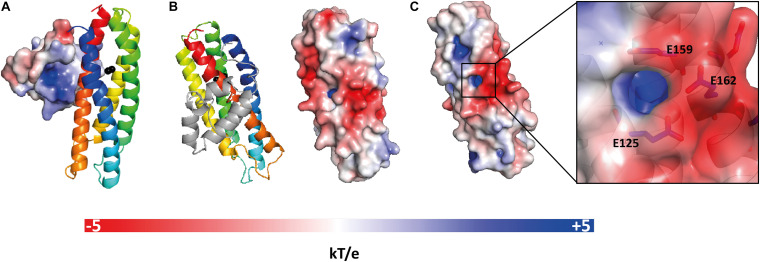
FIGURE 3.
Electrostatic potential at the molecular surface of E. coli YtfEM. (A) Electrostatic potential surface of domain A that faces domain B is positively charged. (B) View of YtfEM rotated 90° about a vertical axis from panel A, the electrostatic surface representation (right) is on the same orientation as the cartoon representation of the structure (left), without domain A. (C) Detail of the electrostatic surface (negatively charged) near the iron cavity (positively charged). The electrostatic potential at the molecular surface was obtained considering that YtfEM is loaded with Fe3+-Fe2+. The electrostatic potential surfaces range from -5 kT/e (red) to +5 kT/e (blue). Figure prepared with PyMOL (DeLano, 2020) using ABPS (Baker et al., 2001) and PDB2PQR (Dolinsky et al., 2004) server to generate the electrostatic potential surface. The charge for each metal was manually added to the PQR file, taking in consideration the oxidation state of the protein.

