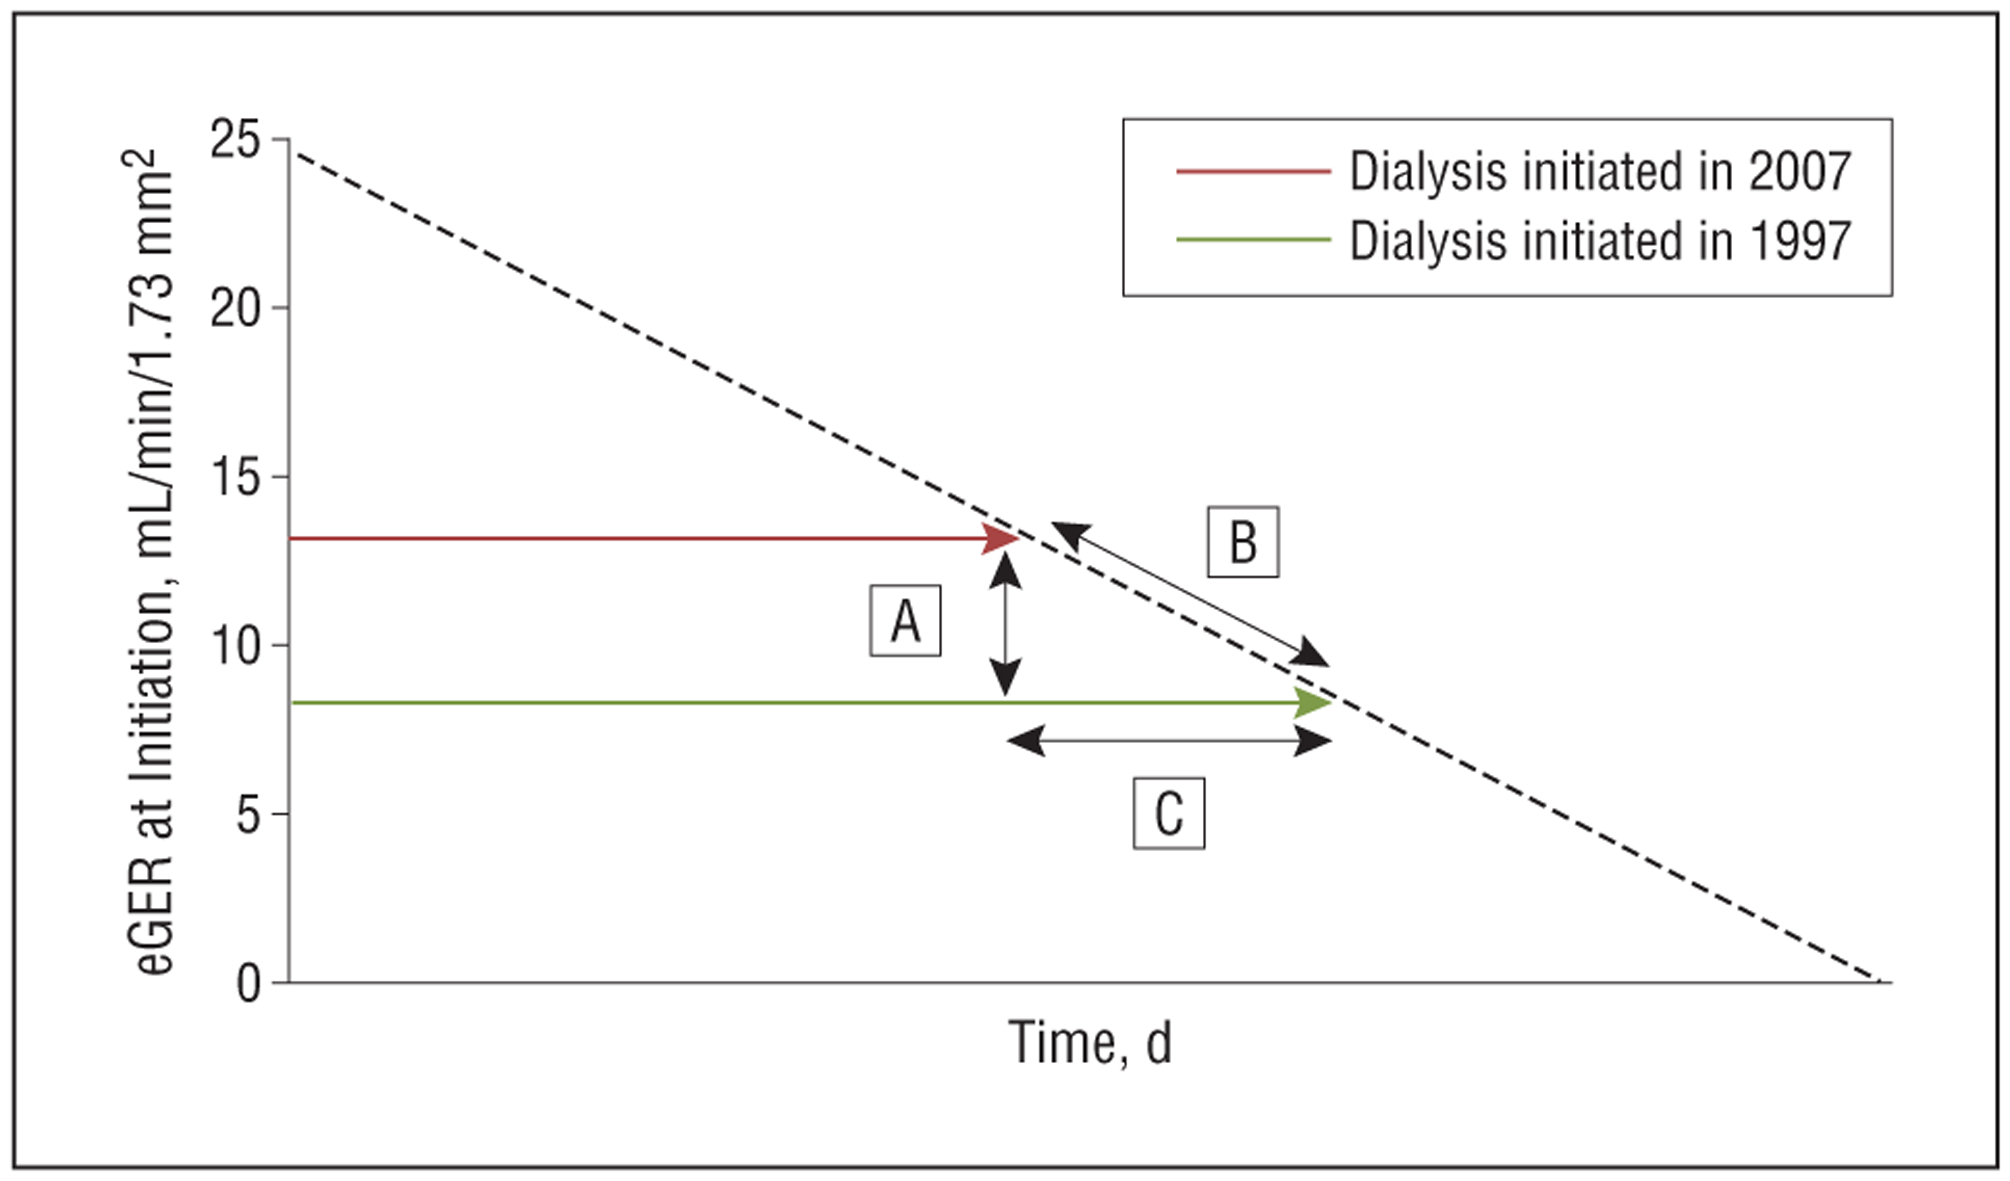
Figure 1.

Schematic to illustrate the relationship between level of renal function at dialysis initiation, loss of renal function prior to initiation, and timing of initiation in a hypothetical patient. A, Difference between each patient’s level of renal function at initiation of dialysis in 2007 and a prediction of the level of renal function at which he or she would have initiated dialysis based on 1997 practice (estimated glomerular filtration rate [eGFR]2007−eGFR1997). B, Prediction of how rapidly each patient was losing renal function prior to dialysis initiation (chronic outpatient eGFR slope before dialysis initiation [SLOPEeGFR]). C, A (difference in eGFR in mL/min/1.73 m2)/B (rate of eGFR loss in mL/min/1.73 m2/day)=number of days earlier patients initiated dialysis in 2007 compared with when they would have initiated dialysis based on 1997 practice.
