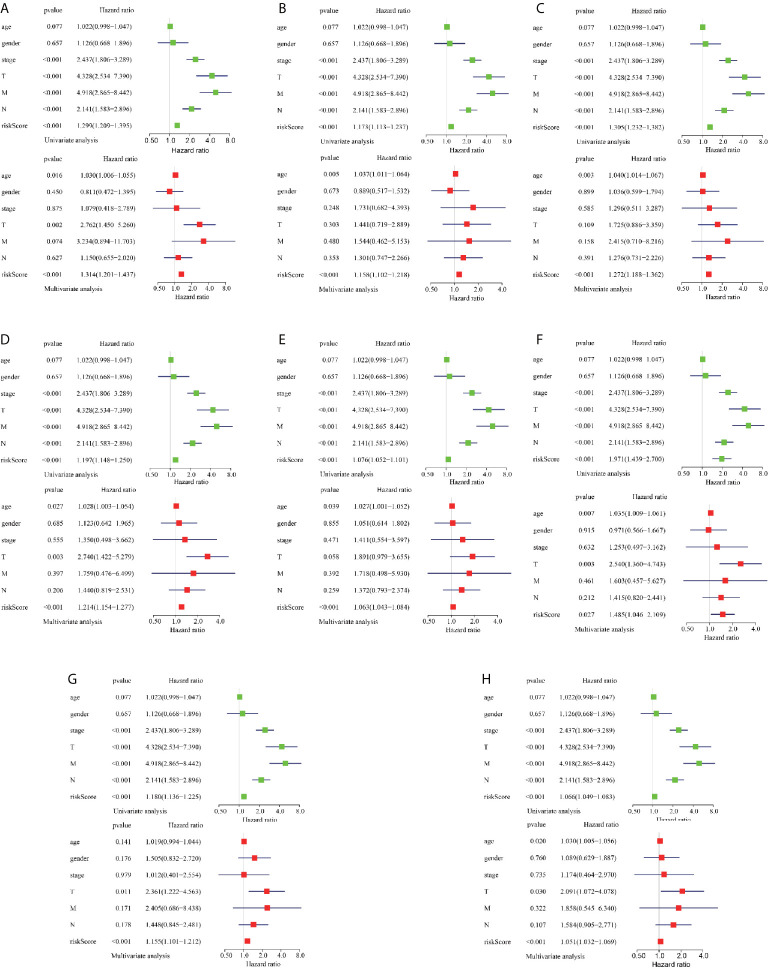
Figure 5.
Assessment of AS risk model in predicting CRC prognosis. (A–H) represents the AS events AA, AD, AP, AT, ES, ME, RI, and total events, respectively. Forest plot visualizing hazard ratios of significant survival-related clinical pathological parameters including age, gender, stage, and pathological stage T, M, and N obtained by univariate (top-green point) and multivariate (bottom-red point) Cox regression analysis.

