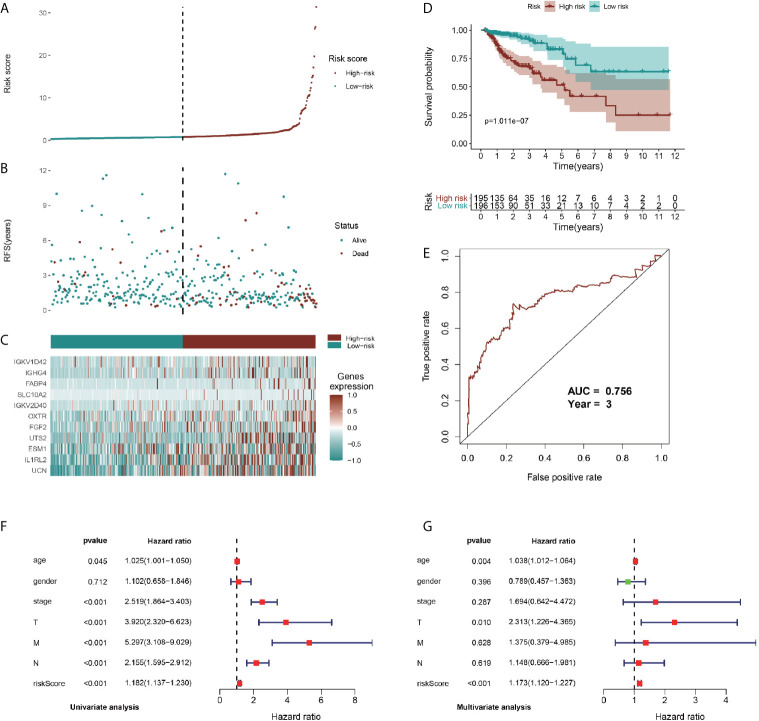
Figure 6.
Identification, construction, and validation of the TII prognostic model system in CRC. (A, B) Patient survival data in the two risk groups. (C) Heatmap plot showing differences in levels of identified hub immune signature between high-risk and low-risk groups. (D) Kaplan-Meier curves of prognostic signature for CRC patients. (E) 3-year ROC curves for prognostic predictors. Univariate (F) and multivariate (G) Cox regression analyses were conducted to assess the immune-related signatures and clinic characteristics using Forest plots.

