
Figure 5.
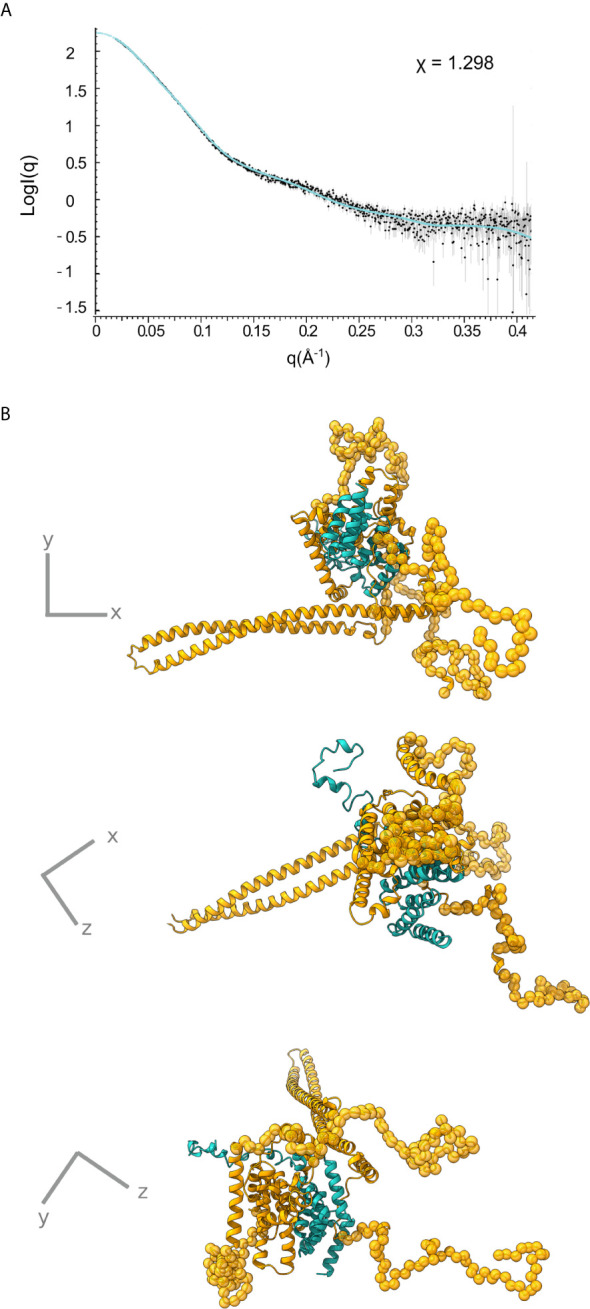
IpgC/IpaB SAXS model. (A) Fit of the theoretical SAXS pattern calculated from the model in (B) to the experimental SAXS data. (B) Three perpendicular representations of the IpgC/IpaB SAXS model. IpaB is depicted in yellow-gold and IpgC in turquoise. Residues where high resolution information is available (crystal structure or homology model) are shown in cartoon representation while spheres represent dummy residues.