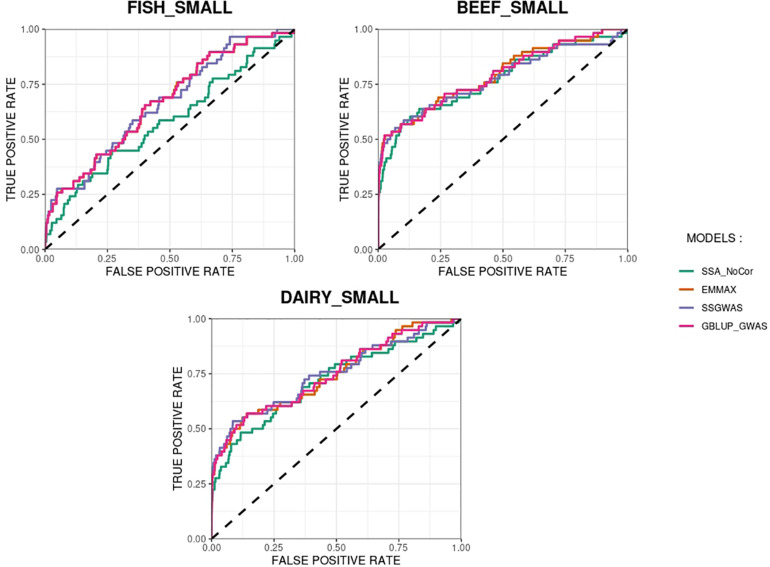
FIGURE 11.
Receiver operating characteristic (ROC) curves for GWAS results for the small populations of fish, beef cattle, dairy cattle with ten daughters per sire. The association methods used were single-SNP analysis without correction for population structure (SSA-NoCor), efficient mixed-model association expedited (EMMAX), single-step GWAS (ssGWAS), and genomic best linear unbiased prediction GWAS (GBLUP-GWAS). The dashed line has slope equal to one and null intercept.

