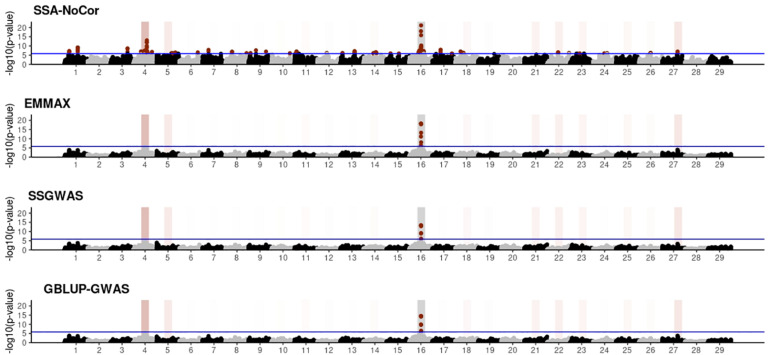
FIGURE 5.
Manhattan plots for the small population of fish using single-SNP analysis without correction for population structure (SSA-NoCor), efficient mixed-model association expedited (EMMAX), single-step GWAS (ssGWAS), and genomic best linear unbiased prediction GWAS (GBLUP-GWAS). Significant SNPs are indicated in red, whereas vertical bars indicate the position of the simulated quantitative trait nucleotide (QTN). The darker the vertical bar, the stronger QTN effect. The blue horizontal line corresponds to the rejection threshold based on a significance level of 0.05 with a Bonferroni correction for multiple testing.

