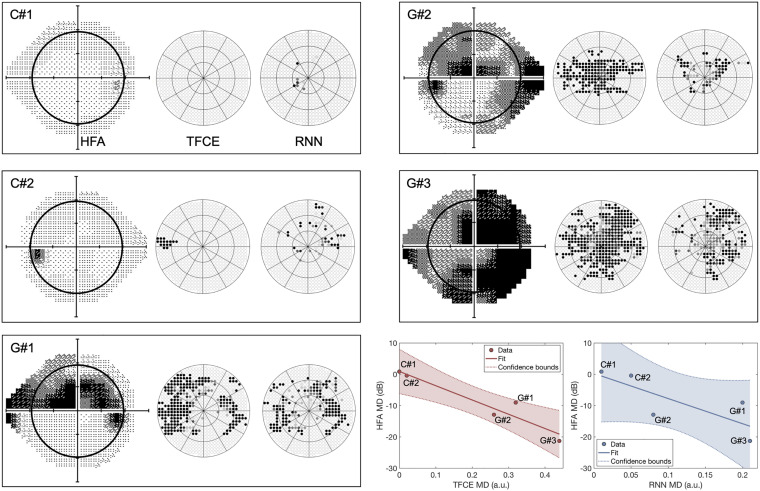
FIGURE 10.
Perimetric maps of the five patients tested with our continuous tracking test. The TFCE maps are reconstructed using as λn the average of the values obtained by each fold (see Figure 6). C#1 and C#2 are healthy controls, while G#1, G#2, and G#3 and patients previously diagnosed with Primary Open Angle Glaucoma. The black circle within the HFA maps represents the portion of the visual field covered by the TFCE and RNN maps. The TFCE method shows a significant correlation between its Mean Deviation index and the one obtained with the HFA, whereas the RNN method does not (, pTFCE = 0.0117; , pRNN = 0.112).

