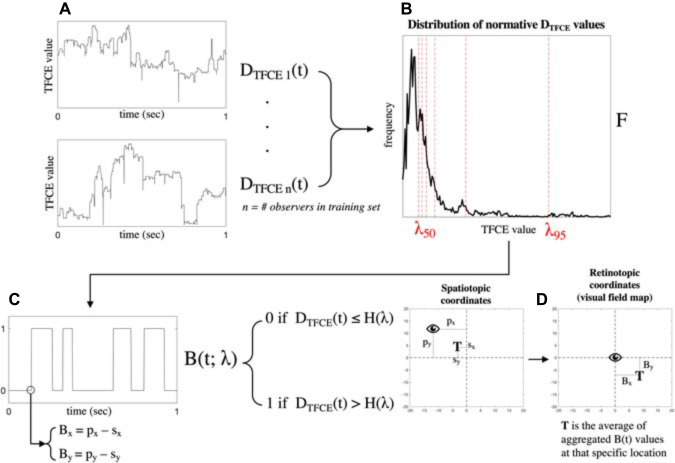
FIGURE 5.
Schematic representation of the algorithm pipeline. Starting from the TFCE-filtered time-series in panel (A), a probability distribution F of all possible normative TFCE values is computed in panel (B). For all percentiles λn of the distribution F, a threshold value F(λn) is defined and used to binarize the TFCE-filtered signal in panel (C). Each time point of the TFCE-filtered signal has associated with it the spatiotopic coordinates of gaze (px and py) and the stimulus positions (sx and sy), which are converted into retinotopic coordinates Bx and By. The resulting mapped retinotopic coordinates in panel (D) are associated with a target location T which contains the average of the aggregated B(t) values at that specific location. B(t) is the expected probability that that specific location is affected by a scotoma. An analogous back-projection algorithm is implemented for the reconstruction of the visual field using the recurrent neural network (RNN), where the binarized time-series in panel (C) is defined by the output of the model instead of the threshold F(λn).

