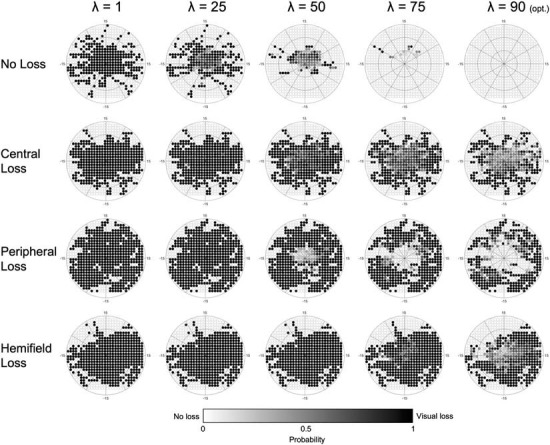
FIGURE 7.

Example of the effect that adjusting the λ parameter has on a single participant, across all conditions. As the optimal λ (90) is approached, the number of false positives across all conditions is minimized. Darker colors indicate a higher probability of that point being affected by visual loss (white = 0%, black = 100%).
