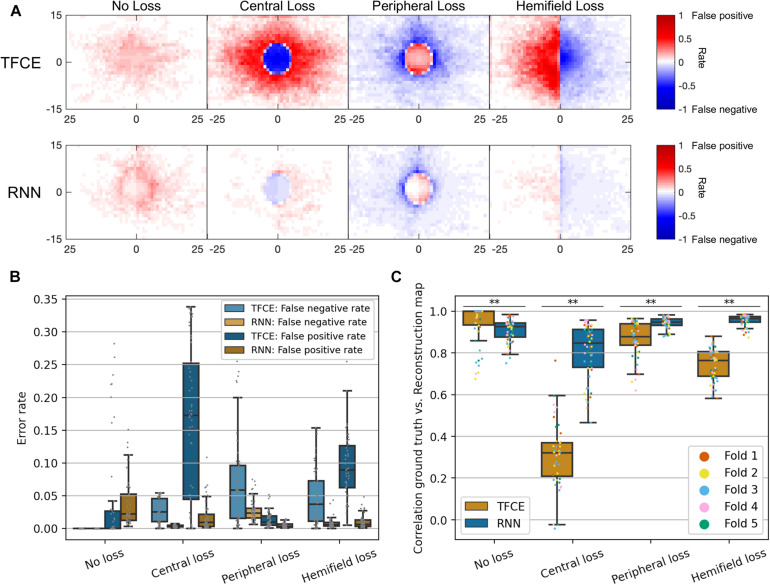
FIGURE 9.
(A) Spatial distributions of false positives and false negatives rates for each condition and for both TFCE and RNN methods. (B) Total error rates combining false positive rate and false negative rate of TFCE and RNN. (C) Comparison between TFCE and RNN visual field map reconstruction accuracies. The RNN method shows higher correlations with the ground-truth as well as being more consistent than the TFCE method. Statistically significant differences (p < 0.001) are found across all tested conditions. Error bars show the 10th and 90th percentiles of each distribution.

