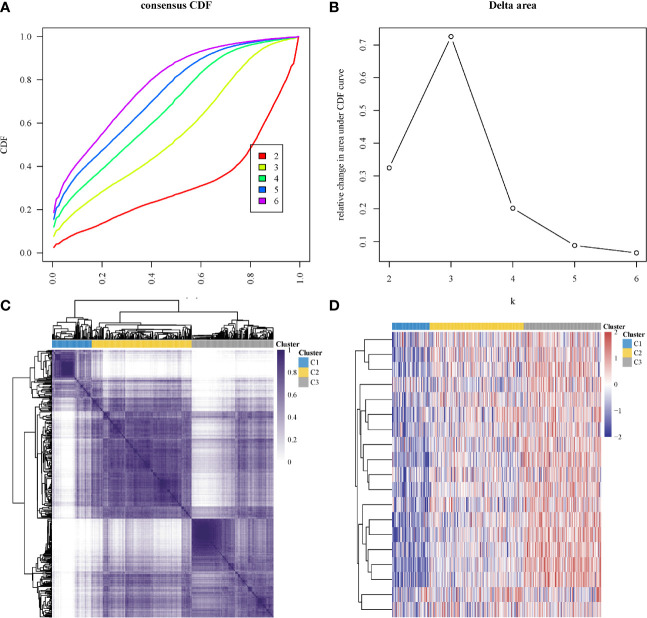
Figure 6.
Identification of consensus clusters according to the expression similarity of hippo core genes. (A) Cumulative distribution function (CDF)(k = 2–6); (B) Relative change in area under CDF curve (k = 2–6); (C) the matrix of consensus clustering (k = 3); (D) heatmap of m6A-related gene expression in different subgroups, red represents high expression while blue represents low expression.

