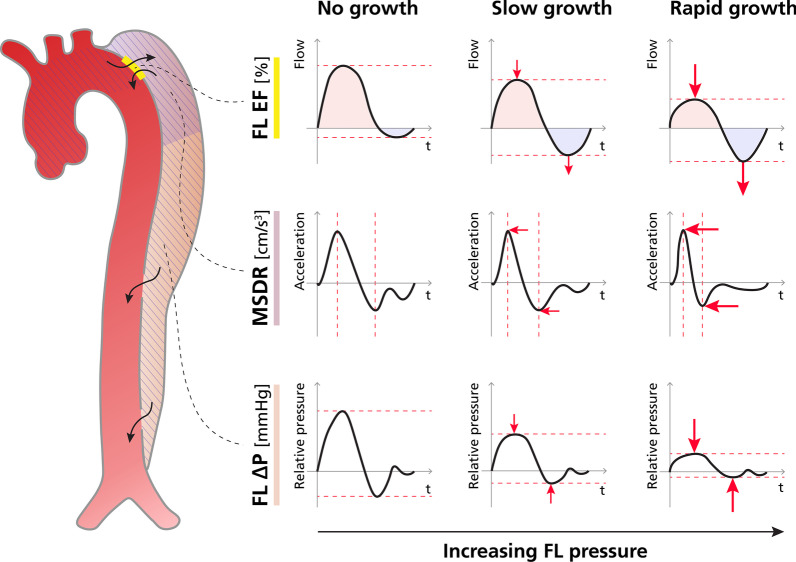
Fig. 4.
Conceptual model depicting the proposed relations between growth and 4D Flow-derived markers of FL pressurization. False lumen ejection fraction (FLEF): The top row depicts increased retrograde flow (light blue) relative to antegrade flow (light red) with increasing aortic growth rate, hypothesized to be related to increased FL pressurization. Maximum systolic deceleration rate (MSDR): The middle row depicts the acceleration of blood through a proximal portion of the FL (the light purple shaded area), with MSDR representing the mean rate of change between peak acceleration and peak deceleration (i.e. the downward slope between peaks). With increasing FL pressurization, higher resistance FL flow leads to faster flow deceleration (i.e. a more pronounced, steeper slope). FL maximal relative pressure (FL ΔPmax): The bottom row depicts the observed trend between decreased relative pressure between the aortic root and the distal FL (the striped region in the TBAD to the left) and increasing aortic growth rate. Increased FL pressurization leads to increased resistance to flow, and thus dampening of relative pressure gradients

