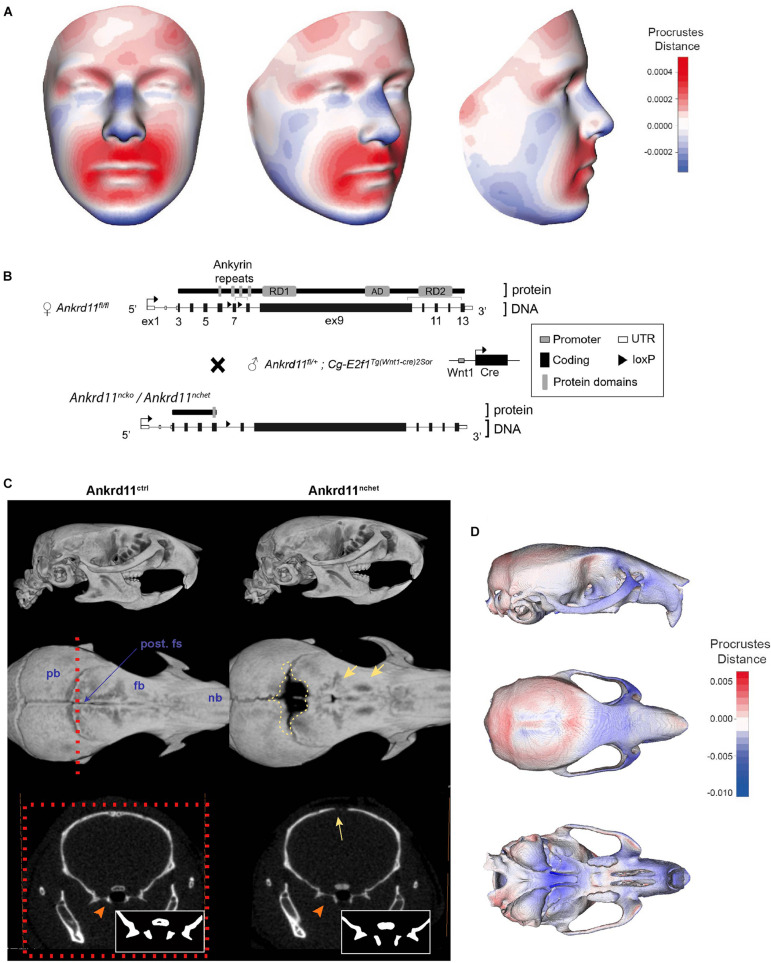
FIGURE 1.
KBG syndrome patients and Ankrd11nchet mice share craniofacial similarities. (A) Mesh morphometric analysis of 4 KBG syndrome patient 3D images. Images shown are a mean representation of craniofacial changes on a reference face. Heat map representation in Procrustes distance (relative to superimposition). Red color indicates positive change in size relative to reference mesh and blue indicates negative size difference. White color indicates no change in highlighted region. (B) Brief summary of gene targeting and breeding strategy to produce Ankrd11nchet mice, shown in panels (C,D), and Ankrd11ncko mice. (C) Reconstructions of μCT scans of Ankrd11ctrl (Ankrd11wt/fl) and Ankrd11nchet mice. Top panel: lateral view of whole skull. Middle panel: Superior view of frontal bone; mandible and cranial base are clipped out of plane. Red dotted line indicates plane of sectioning for lower row of panels. Yellow dotted line highlights calvarial defect surrounding posterior frontal suture in Ankrd11nchet mice. Yellow arrows point to regions of hard tissue anomalies in Ankrd11nchet frontal bone. Lower panels: orthogonal slice through posterior frontal suture indicating pterygoid abnormalities (orange arrow) and open posterior frontal suture (yellow arrow). Inset in lower right corner of images is high contrast representation of cranial base structures affected in image. pb, parietal bone; fb, frontal bone; nb, nasal bone; post. fs, posterior frontal suture. (D) Mesh morphometric analysis of three Ankrd11nchet mouse skulls. Images shown are a mean mesh of three Ankrd11nchet skulls relative to a mean mesh of five Ankrd11ctrl skulls. Note: mandibles were excluded from analysis due to the variable position with respect to the skull. Colors depict Procrustes distances between Ankrd11ctrl and Ankrd11nchet mean meshes, with blue indicating negative values (Ankrd11nchet values fall within Ankrd11ctrl mesh) and red indicating positive values (Ankrd11nchet values fall outside of Ankrd11ctrl mesh). White values indicate no changes, meaning the vertices for these anatomical regions in both mice are very close.

