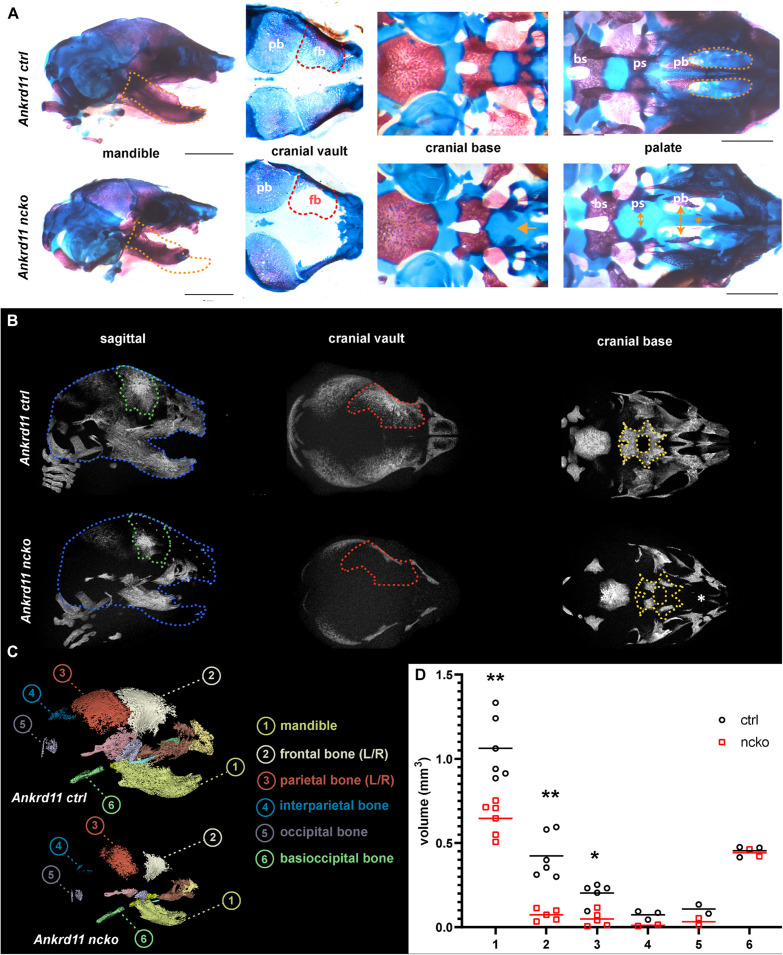
FIGURE 2.
Ankrd11ncko mice have compromised ossification in craniofacial structures at birth. (A) Wholemount images of postnatal day 0 (P0) skull skeletal preparations, stained with Alizarin red and Alcian blue. Left panels: Orange dotted lines outline Ankrd11ctrl (Ankrd11fl/fl) mandible to indicate micrognathia in the mutant. Middle left panels: Red dotted lines outline Ankrd11ctrl (Ankrd11fl/fl) frontal bone to indicate its smaller size in the mutant. Middle right panels: Yellow arrows indicate extra space between presphenoid and palatine bones of the cranial base. Yellow asterisk to the right highlights clefting of hard palate in Ankrd11ncko mouse. Right panels: magnified view of palate. bs, basisphenoid bone; ps, presphenoid bone; pb, palatine bone. Scale bar represents 2 mm, third column represents 1 mm. (B) μCT scans of P0 Ankrd11ncko and Ankrd11ctrl skulls reconstructed in Amira. Blue dotted lines: Ankrd11ctrl skull outline. Green dotted lines: control frontal bone outline. Tan dotted fill in Ankrd11ncko: negative space between control mouse and mutant. Red dotted lines: control frontal bone outline. Yellow dotted lines: control basisphenoid and presphenoid hard tissue outline. White asterisk indicates reduction in palatine bone ossification in the mutant mouse. (C) representative segmentation of individual bones from μCT scans of P0 Ankrd11ncko and Ankrd11ctrl skulls. (D) Quantification of segmented bone volumes (mm3) from Ankrd11ncko and Ankrd11ctrl pups (independent two-sample t-test assuming unequal variances, **p < 0.001, *p < 0.05, n = 6). Segmentation and volume analysis performed using 3D Slicer.

