FIGURE 3.

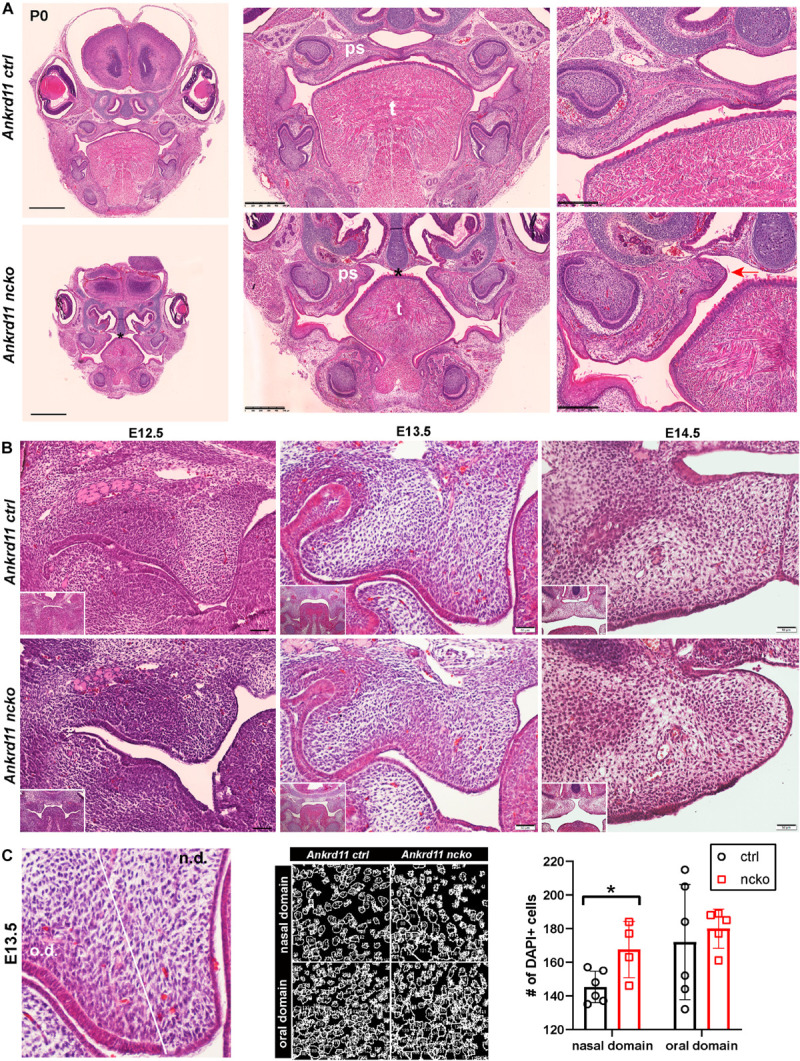
Ankrd11ncko mice display craniofacial changes early in development. Hematoxylin and eosin (H&E) stain. (A) Representative images of P0 coronal sections of Ankrd11ctrl (top) and Ankrd11ncko (bottom) skulls. Note relative size difference between heads. Black asterisk indicates absence of complete palatine boundary separating oral and nasal cavities in Ankrd11ncko image. Second column images demonstrate overall differences in oral cavity, including smaller tongue and cleft palate. Differences in plane of section in mandible are due to retrognathia in Ankrd11ncko mice. Right panels focus on palatal shelves, with red arrow indicating unfused advancing medial edge of palatal shelf in mutant mouse. t, tongue; ps, palatal shelf; *cleft palate. Scale bar indicates: 1 mm (first column), 500 μm (second column), and 250 μm (third column). (B) Coronal sections of palatal shelves at E12.5, E13.5, and E14.5. Inset in lower right corner of each view is lower magnification image of same mouse, showing overall organization of oral cavity in each mouse. n = 3 from 3 litters. Scale bar represents 50 μm. (C) Analysis of cell density based on DAPI stain in E13.5 palatal shelves separated into oral and nasal domains. Left: representative H&E stain. Middle: ImageJ-generated density profile showing individual cells. Right: Statistical representation of analysis showing increased cell density in the nasal domain of Ankrd11ncko palatal shelves (independent two-sample T-test assuming unequal variances, *p < 0.05). n.d., nasal domain; o.d., oral domain.
