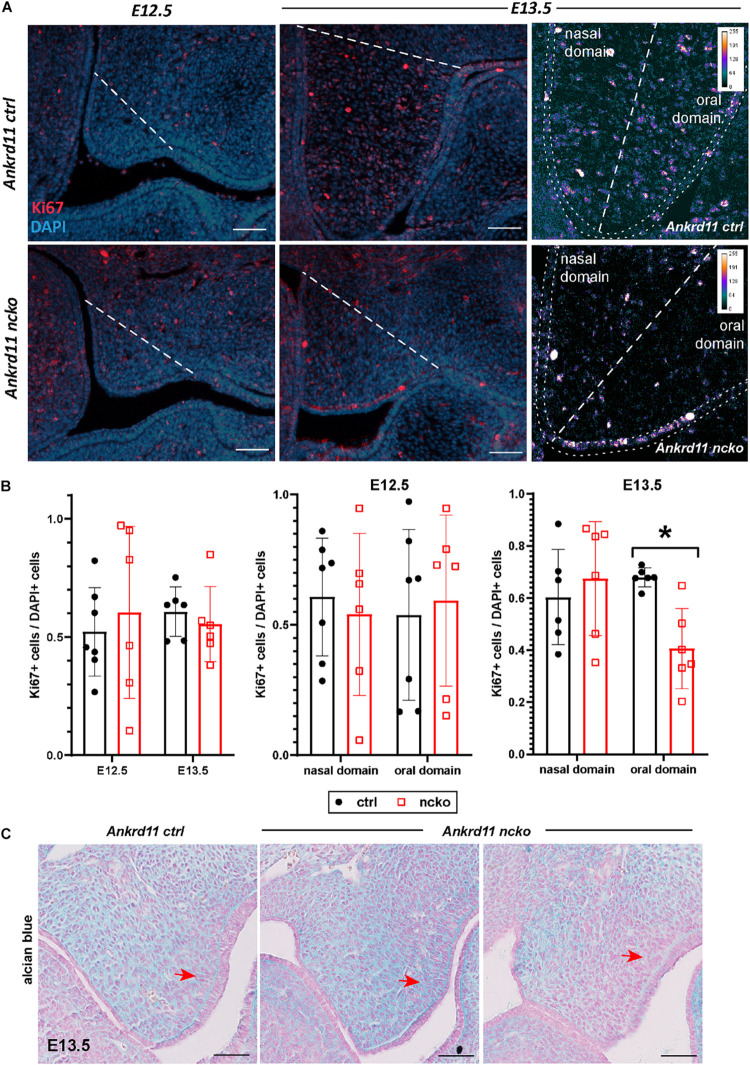
FIGURE 5.
Palatal shelf proliferation is locally affected in Ankrd11ncko embryos. (A) Representative images of palatal shelves at each age and timepoint immunostained for Ki67 (red). DAPI-labeled nuclei are in blue. White dotted line delineates region counted for quantification shown in (B). White scale bars represent 50 μm. Right panels: Magnification of E13.5 palatal shelf showing heatmap of Ki67 expression using ImageJ. White dotted line separates the nasal and oral domains of the palatal shelf. Scale bars represent 50 μm. (B) Left panel: Quantification of Ki67-positive cells relative to DAPI-positive nuclei plotted for each genotype (Ankrd11ctrl depicted in black and Ankrd11ncko depicted in red at E12.5 and E13.5). Middle and right panel: Cell proliferation in nasal and oral domains respectively (independent two-sample T-test assuming unequal variances, minimum of six sections/genotype from minimum of five embryos per genotype, *p < 0.05, n = 6). (C) Alcian blue/nuclear fast red staining of E13.5 palatal shelves. Red arrow indicates mesenchymal cells lining epithelium on buccal side of shelf. n = 3/genotype, representative images shown. Scale bars represent 50 μm.

