FIGURE 8.
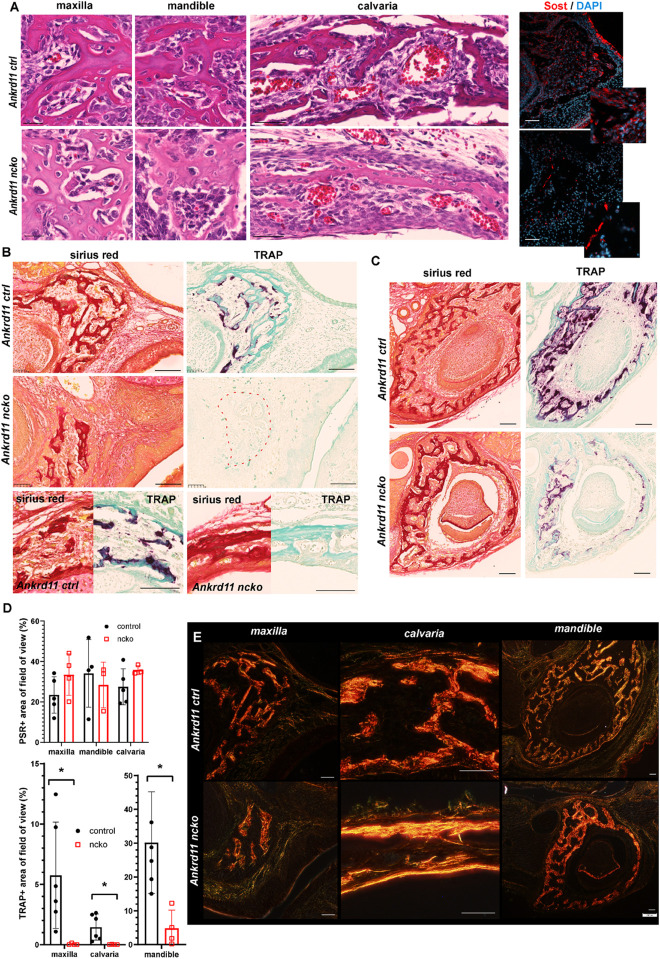
Bone maturation is delayed in Ankrd11ncko mice. (A) Representative sections of maxillary, mandibular, and calvarial bone from Ankrd11ctrl (top row) and Ankrd11ncko (bottom row) mice at P0. Sections were stained simultaneously for H&E to reveal cell morphology and bone organization. Images were taken at anatomically matching locations. Images in right column depict sections immunostained for sclerostin (Sost, red) in the P0 maxillary bone, demonstrating a reduction in Sost+ cells in Ankrd11ncko maxillary bone. DAPI (blue) was used to counterstain nuclei. Scale bars in first two columns represent 25 μm, and last two represent 50 μm. (B) Sirius red and tartrate-resistant acid phosphatase (TRAP) staining of maxilla and calvaria of Ankrd11ctrl and Ankrd11ncko mice at P0 on neighboring sections. Red dotted line outlines region of bone in Ankrd11ncko maxilla with no TRAP-positive cells, indicating a reduction in remodeling. Calvarial images are taken at the same point midway between the eye and fontanelle. Scale bars represent 100 μm. (C) Sirius red and TRAP staining of the mandible in Ankrd11ctrl and Ankrd11ncko mice at P0 showing a decrease in TRAP-positive cells in the mandibular bone. Scale bars represent 100 μm. (D) Quantification of images shown in (B,C) (independent two-sample T-test assuming unequal variances, *p < 0.05, n = 5). (E) Polarized light images of sirius red stained maxilla, calvaria, and mandible in control and Ankrd11ncko mice at P0 showing differences in extent of collagen fibril interconnection and orientation. Scale bars represent 50 μm.

