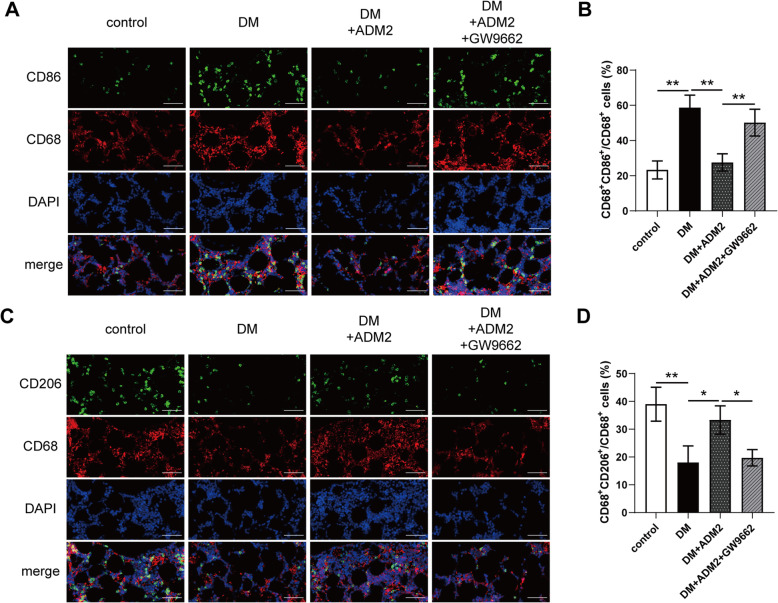
Fig. 6.
ADM2 reversed the imbalance of M1/M2 polarization during distraction osteogenesis in diabetic rats. A Immunofluorescence staining images of CD68 and CD86 for the distraction area sections from the four groups. Scale bar 100 μm. B Quantitative analysis of CD68+CD86+/CD68+ M1 macrophage ratio for the distraction area sections from the four groups. C Immunofluorescence staining images of CD68 and CD206 for the distraction area sections from the four groups. Scale bar 100 μm. D Quantitative analysis of CD68+CD206+/CD68+ M2 macrophage ratio for the distraction area sections from the four groups. The data were confirmed by one-way analysis of variance (ANOVA) followed by Tukey’s post hoc test from three independently repeated tests and are presented as the means ± SD. *P < 0.05; **P < 0.01

