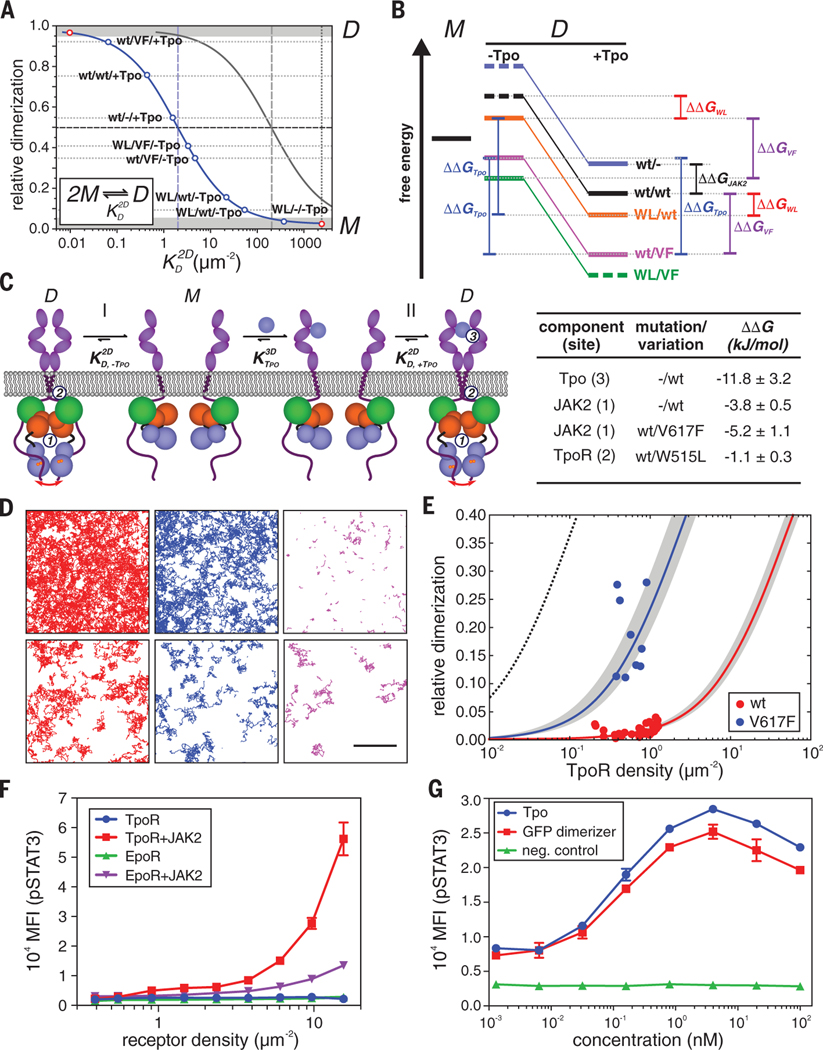
Fig. 4. Energy landscape of TpoR dimerization and its mechanistic interpretation.
(A) Determination of 2D equilibrium dissociation constants from the dimerization levels observed under different conditions. Each dot corresponds to a dimerization experiment where the label denotes TpoR [wt or W515L (WL)]/JAK2 [wt or V617F (VF)]/ligand (+/–Tpo). The 2D law of mass action is depicted for a monomer-dimer (M-D) equilibrium at a total receptor surface concentration of 2 μm–2 (blue) and 200 μm–2 (gray). Dimerization levels that cannot be unambiguously quantified by co-tracking are indicated by gray zones. (B) Semi-quantitative energy diagram of the M-D equilibrium in the absence (–Tpo) and presence (+Tpo) of ligand as derived from (A). Experiments involving different TpoR/JAK2 combinations are depicted in different colors; energy levels for determining different values of ΔΔG are indicated. Energetic contributions ΔΔG obtained for different combinations of components and mutations are listed in the table below. (C) Proposed mechanism of homodimeric cytokine receptor activation deduced from live-cell dimerization assays: In the absence of ligand (I), the basal level of dimerization caused by interactions mediated via the JAK2 PK domains (1) and TM/JM domains (2) is negligible because substantially exceeds the receptor surface concentration in the plasma membrane. Ligand binding provides the additional binding energy (3) required to shift the equilibrium toward the dimeric state. Oncogenic mutations enhancing interactions 1 or 2 shift the equilibrium toward the dimeric state in a ligand-independent manner (II). (D to F) Intrinsic dimerization and activation of TpoR and EpoR. (D) Representative smFRET experiments with TpoR coexpressed with JAK2-mEGFP wt (top) and V617F (bottom) showing single-molecule trajectories of the donor (red) as well as the acceptor upon direct excitation (blue) and via smFRET (magenta) detected within 150 frames (5 s). Total receptor densities were 1.2/μm2 for JAK2 wt and 0.4/μm2 for JAK2 V617F. Scale bar, 5 μm. (E) Relative ligand-independent dimerization levels as a function of receptor density for full-length TpoR in the presence of JAK2 wt and V617F and fit by the law of mass action for a monomer-dimer equilibrium (solid lines). Confidence intervals of the fit are indicated as gray zones. The dimerization curve in the presence of Tpo calculated from the corresponding is shown for comparison (black dotted line). (F) Ligand-independent activation of STAT3 phosphorylation upon overexpression of TpoR and EpoR, respectively, together with JAK2 wt in HeLa cells. pSTAT3 and receptor cell surface densities were quantified by phospho-flow analysis. As a negative control, coexpression of JAK2 was omitted. (G) Activation of mXFP-TpoR by dimerization with an NB-based cross-linker that binds the mXFP-tag. For comparison, activation by Tpo in the presence and absence of TpoR (neg. control) is shown. In (F) and (G), error bars denote SEM.

