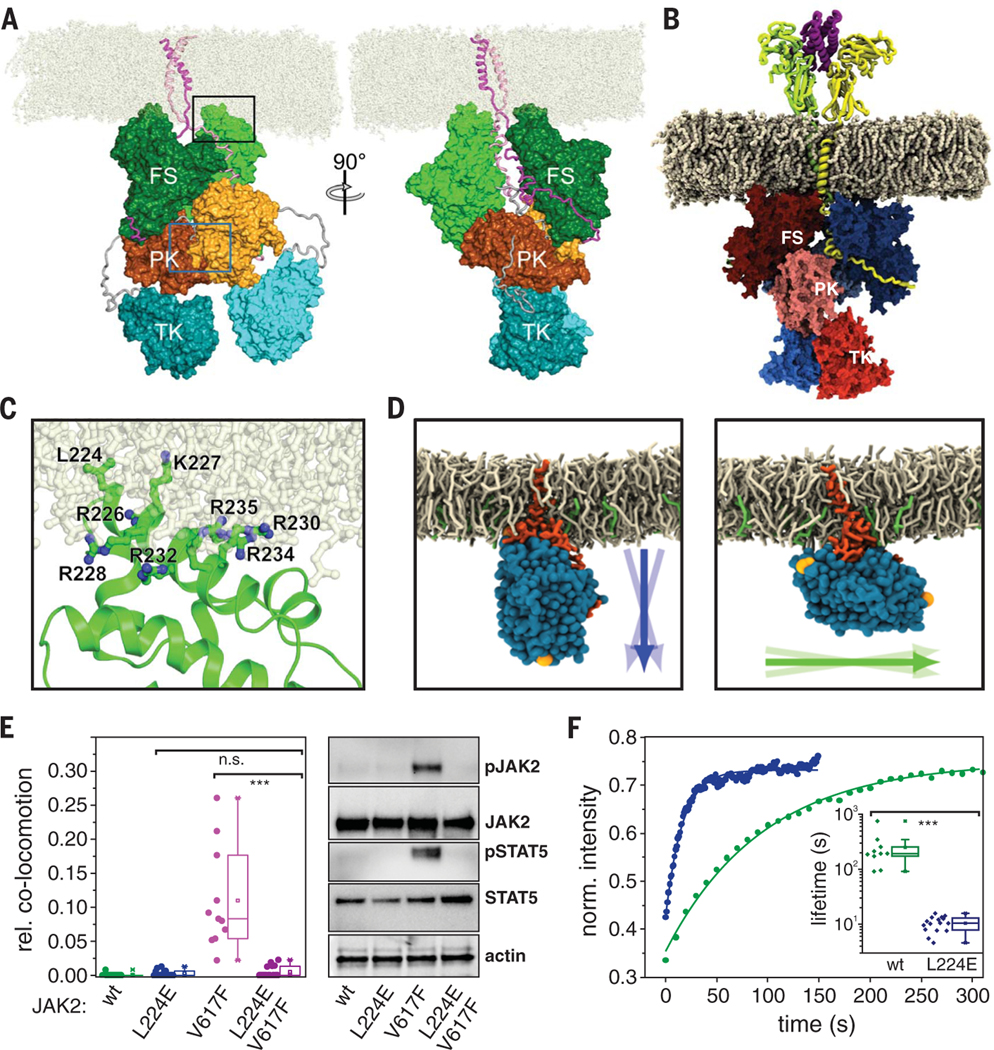
Fig. 6. Structural organization of homodimeric cytokine receptor signaling complexes in the membrane.
(A) Snapshot (t = 1 μs) from all-atom MD simulations of JAK2 bound to TpoR (TM and IC domains) forming a homodimeric complex (system S1AA; movie S11). JAK2 is colored green (FS), orange (PK), and cyan (TK). Protomer 1 is in dark colors with domains labeled; protomer 2 is in light colors and unlabeled. The FS-PK and PK-TK linkers are colored gray. TpoR is colored magenta (bound to JAK2 protomer 1) and pink (bound to JAK2 protomer 2). POPC lipid molecules are colored off-white. The PK-PK interface region highlighted by the green rectangle is shown in Fig. 5B. (B) Snapshot (t = 1 μs) from an all-atom MD simulation of a homodimeric complex of JAK2 bound to EpoR (residues Pro31 to Ser335, system S4AA) in the presence of Epo (movie S12). (C) Membrane binding of the F2 subdomain of FS stabilizes the orientation of JAK2 relative to the membrane [enlarged view of the region indicated by the black rectangle in (A)]. The side chains of Lys224 and the seven Lys and Arg residues in α3 that change orientation and flexibility upon interaction with the membrane are highlighted. (D to F) Functional role of Lys224 in TpoR dimerization and activation. (D) Representative orientation of JAK2 FS wt (left) and L224E (right) observed in MD simulations (systems S14CG and S16CG, respectively). Arrows indicate the orientation of the FS domain and its variation during the simulations. (E) Ligand-independent dimerization of TpoR (left) as well as JAK2 and STAT5 phosphorylation (right) observed for JAK2 wt and V617F upon combination with L224E. (F) Stability of JAK2 FS wt and L224E binding to TpoR probed by live-cell micropatterning (fig. S14C) in combination with FRAP. Representative FRAP curves are shown for JAK2 wt (green) and L224E (blue); the inset, using the same colors, shows a statistical analysis of dissociation rate constants. Each data point represents the analysis from one cell with a minimum of 10 cells measured for each condition. ***P ≤ 0.001.

