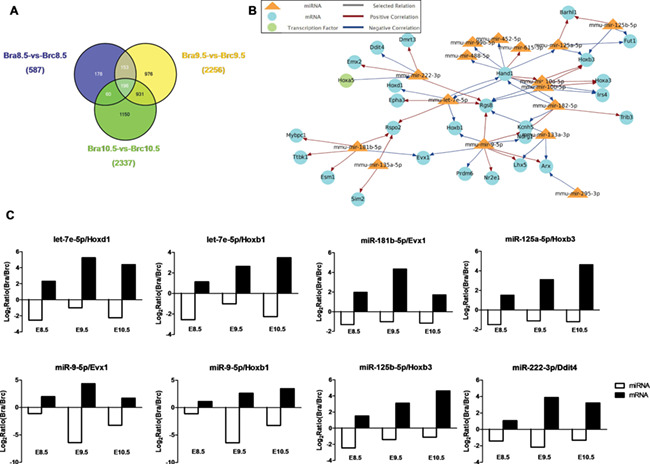
Figure 3.

Functional interactive network analysis of co-expressed DE miRNAs and mRNAs (A) Intersection analysis of DEGs in Brc8.5 vs Bra8.5, Brc9.5 vs Bra9.5, and Brc10.5 vs Bra10.5 represented by Venn diagram (P<0.05, FDR≤0.001, and absolute value of log2 ratio≥1). In total, 196 genes were identified to be significantly differentially expressed. (B) The interactive image with the functional interactions among miRNA, mRNA, and transcription factors was constructed by Magia2. (C) The expression pattern of screened eight miRNA–mRNA pairs in three time points. The horizontal coordinates are the time points, and the vertical coordinates are fold changes.
