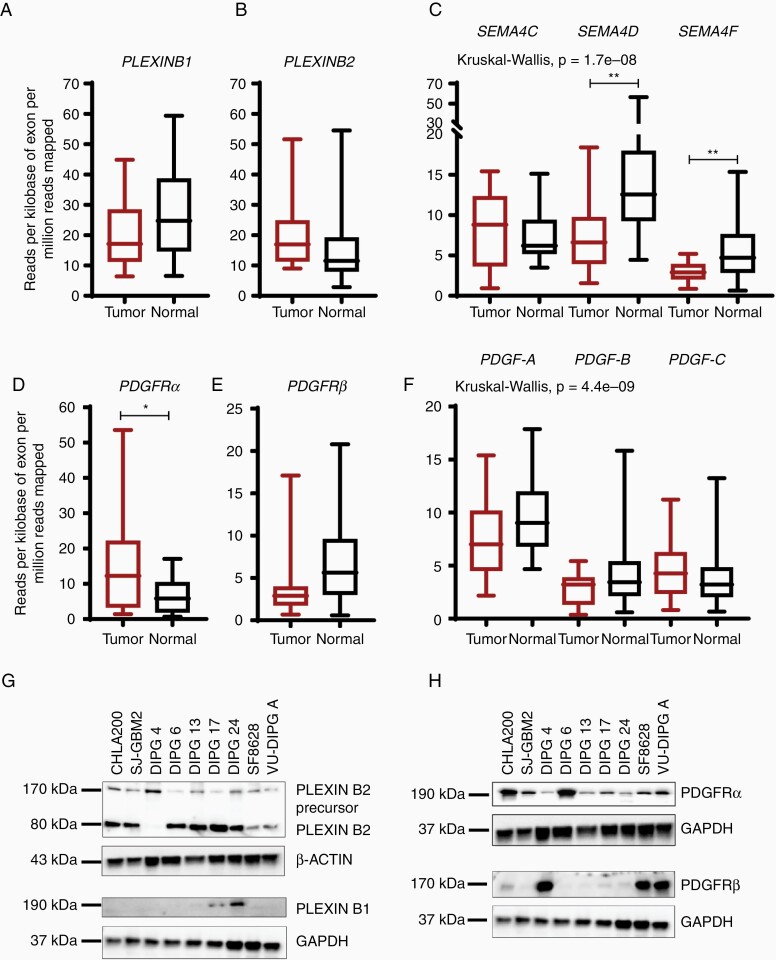
Figure 1.
Aberrant gene and protein expression pattern in DIPG tumor tissues cell lines. (A–C) Box and whisker plots show the relative gene expression of PLEXINB1 and PLEXINB2 receptors and their known ligands, SEMA4C, SEMA4D, and SEMA4F in normal and DIPG tumor samples. The mRNA expression is shown in reads per kilobase of exon per million reads mapped (RPKM). (D–F) mRNA expression of PDGFR (α and β) and their preferred ligands PDGF-AA, PDGF-BB, and PDGF-CC in both normal and DIPG tumor samples. (* denotes P < .05, and ** denotes P < .01). (G,H) Immunoblots of receptors, PLEXINB2, PLEXINB1, PDGFRα, and PDGFRβ show aberrant expression in DIPG tumor cell lines. CHLA 200 and SJ-GBM2 are non-DIPG cell lines and serve as controls. DIPG cells: DIPG 4, DIPG 6, DIPG 13, DIPG 17, DIPG 24, SF-8628, and VU-DIPG A. β-ACTIN and GAPDH were used as loading controls.

