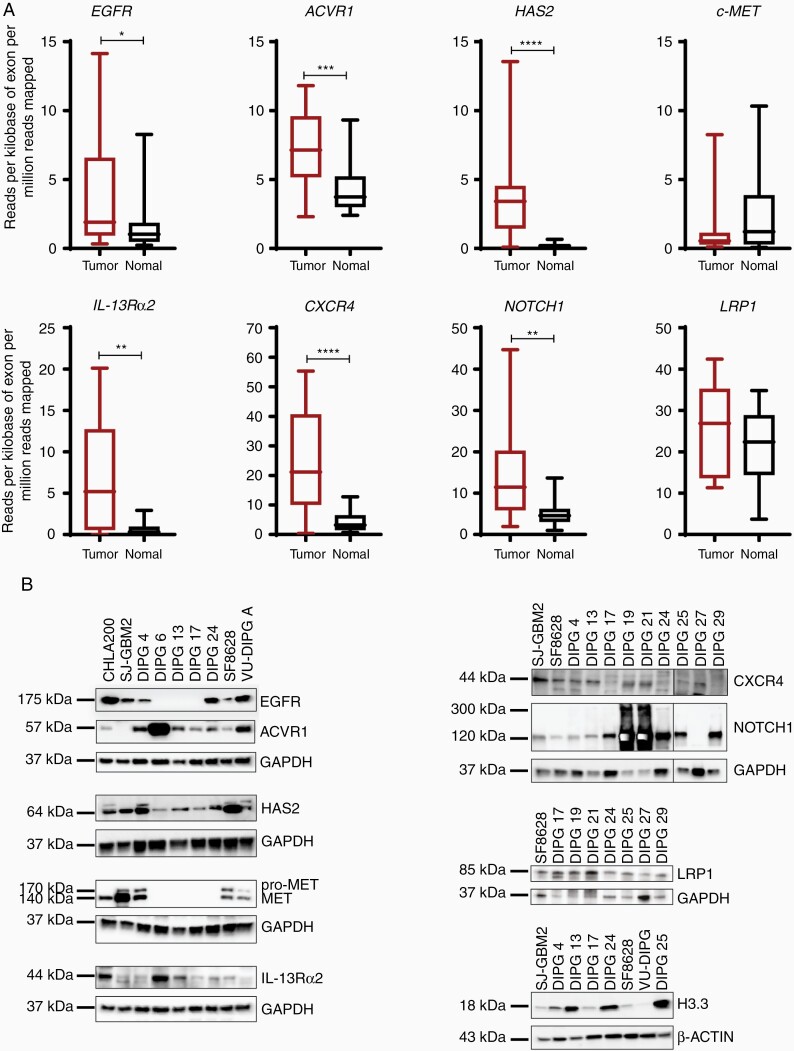
Figure 2.
Gene and protein expression of additional receptors in DIPG tumor tissues and cell lines. (A) RNA-sequencing analysis of multiple receptors showing the relative expression in normal and tumor tissue samples. Gene listed are, EGFR, ACVR1, HAS2, c-MET, IL-13Rα2, CXCR4, NOTCH1, and LRP1. The expression is depicted in RPKM. (* denotes P < .05, ** denotes P < .01, *** denotes P < .001, and **** denotes P < .0001). (B) Western blot analyses show the protein expression of all genes in panel A in multiple DIPG cell lines. Note: additional DIPG cell lines were used for the immunoblots. GAPDH and β-ACTIN were used as loading controls.

