Figure 4.
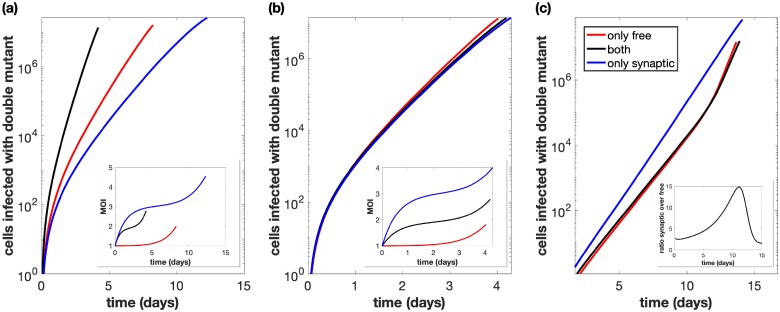
Total number of cells infected with at least one active copy of double-mutant virus plotted against time. The multiplicity of infection (MOI) is included in the inset. We assume we have 109 initial cells, and run the simulation until the number of infected cells reaches 40 per cent of this initial amount, while also assuming that uninfected cells do not divide. Parameters are the best fit parameters from static experiment B2, which are listed in Supplementary Table S2 in the Supplementary Materials. The combination of both transmission pathways is represented by the black lines. For the only free virus transmission case (red lines), synaptic transmission is turned off. For the only synaptic transmission case (blue lines), free virus transmission and reinfection are turned off. (a) Parameters are exactly as in the experiment. (b) The overall growth rate is the same across the three cases. (c) The overall growth rate is the same across the three cases and the simulation starts with only a single infected cell, which is coinfected with both single-mutant strains.

