
Figure 1. LDL-aggregation in subjects with peripheral artery disease.
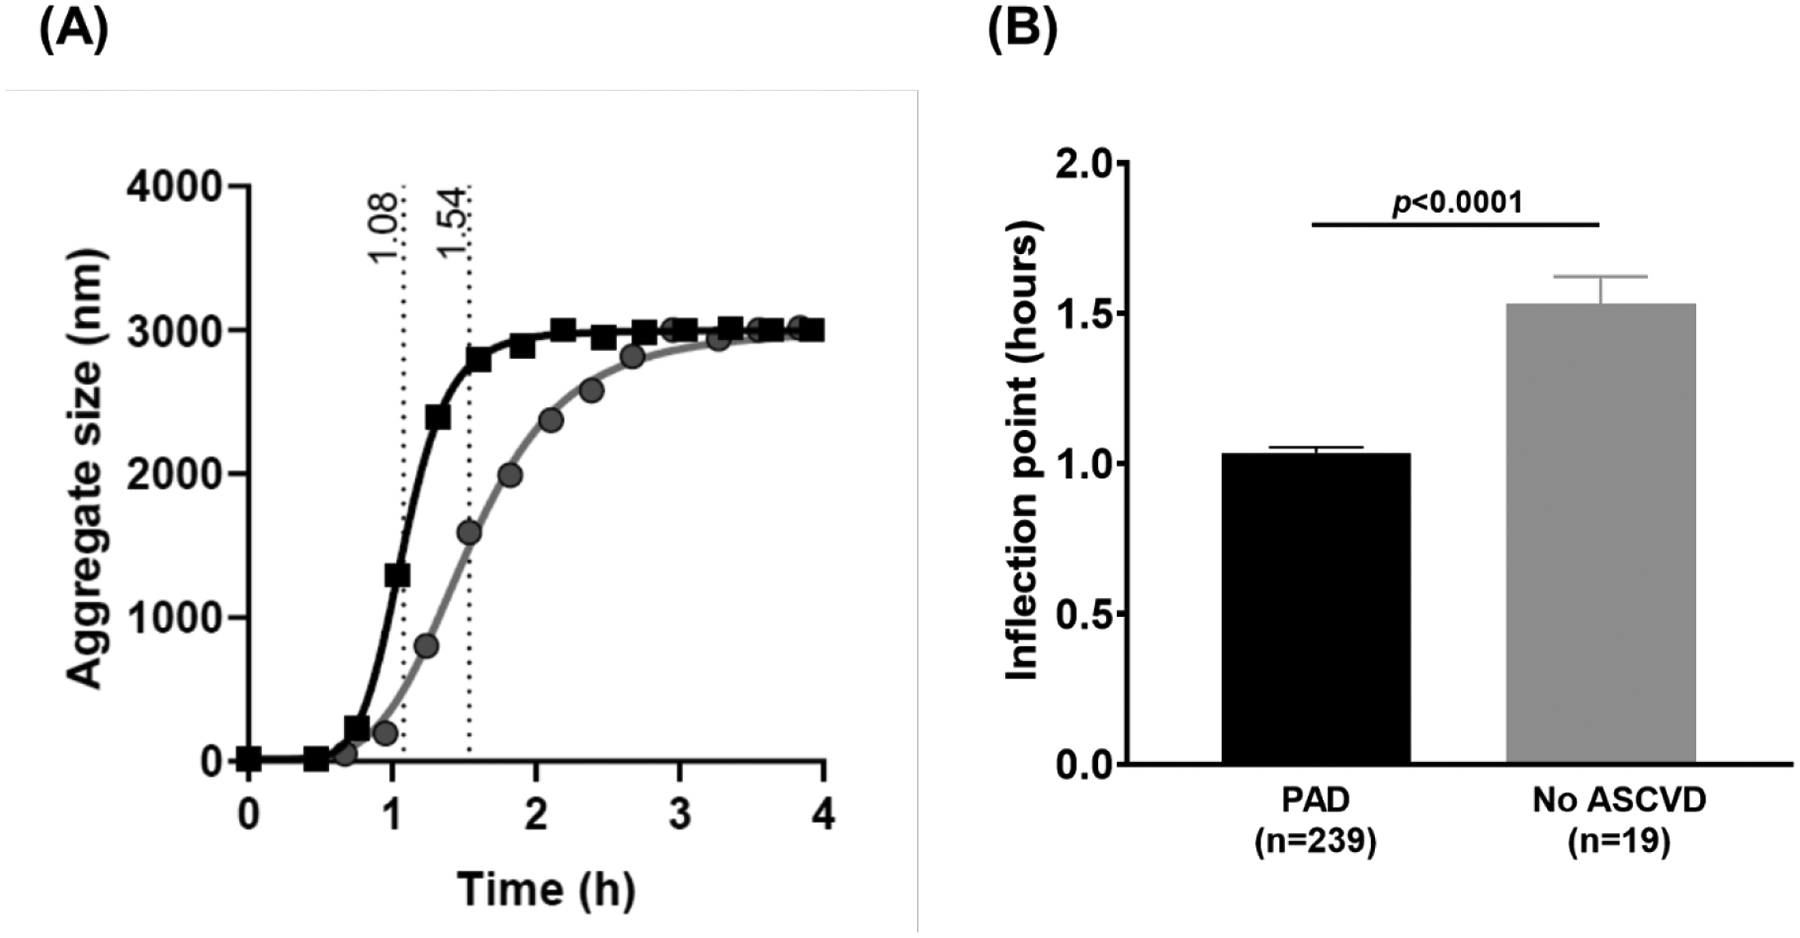
(A) Representative aggregation curves of a PAD subject (black squares) and healthy control subject (gray circles) with inflection point highlighted. (B) LDL aggregation inflection point in all subjects with peripheral artery disease (n=239) and control subjects without known atherosclerotic cardiovascular disease (n=19). Comparison with two sample t-tests.