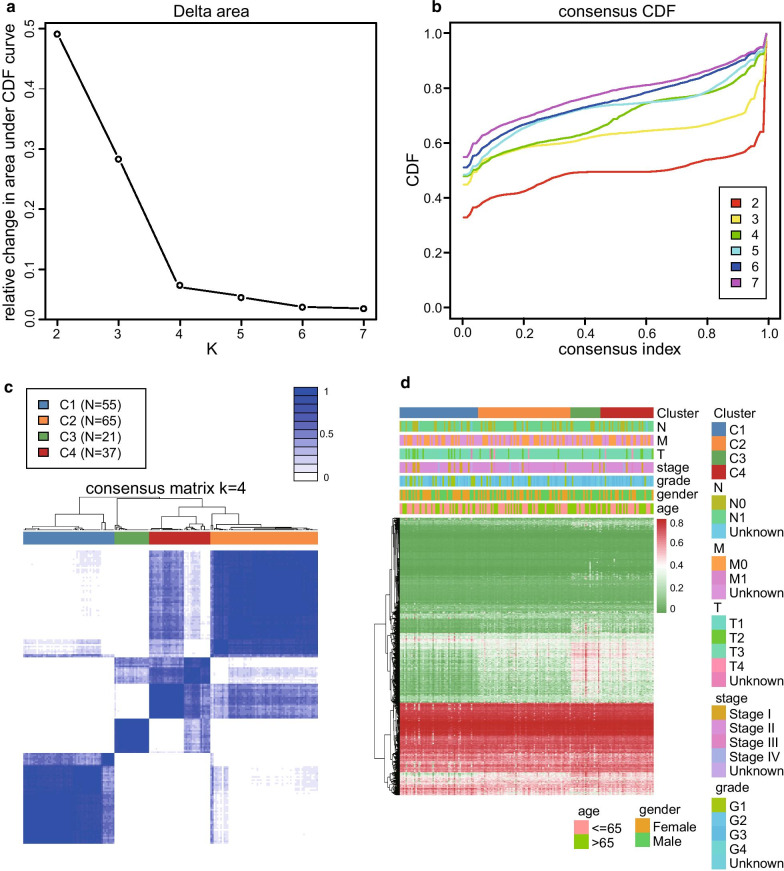
Fig. 1.
Identification of the four molecular subgroups by using the consensus clustering analysis. a Relationship between the relative changes in the area under the cumulative distribution function (CDF) curve and the numbers of the molecular subgroups (K value). b Consensus CDF of the different numbers of clusters. The X-axis represents the consensus index. c Heat map of the consensus matrix when the total samples are clustered into four molecular subgroups (K = 4). d Heat map of 4227 CpG sites data and corresponding clinicopathological information of the four molecular subgroups

