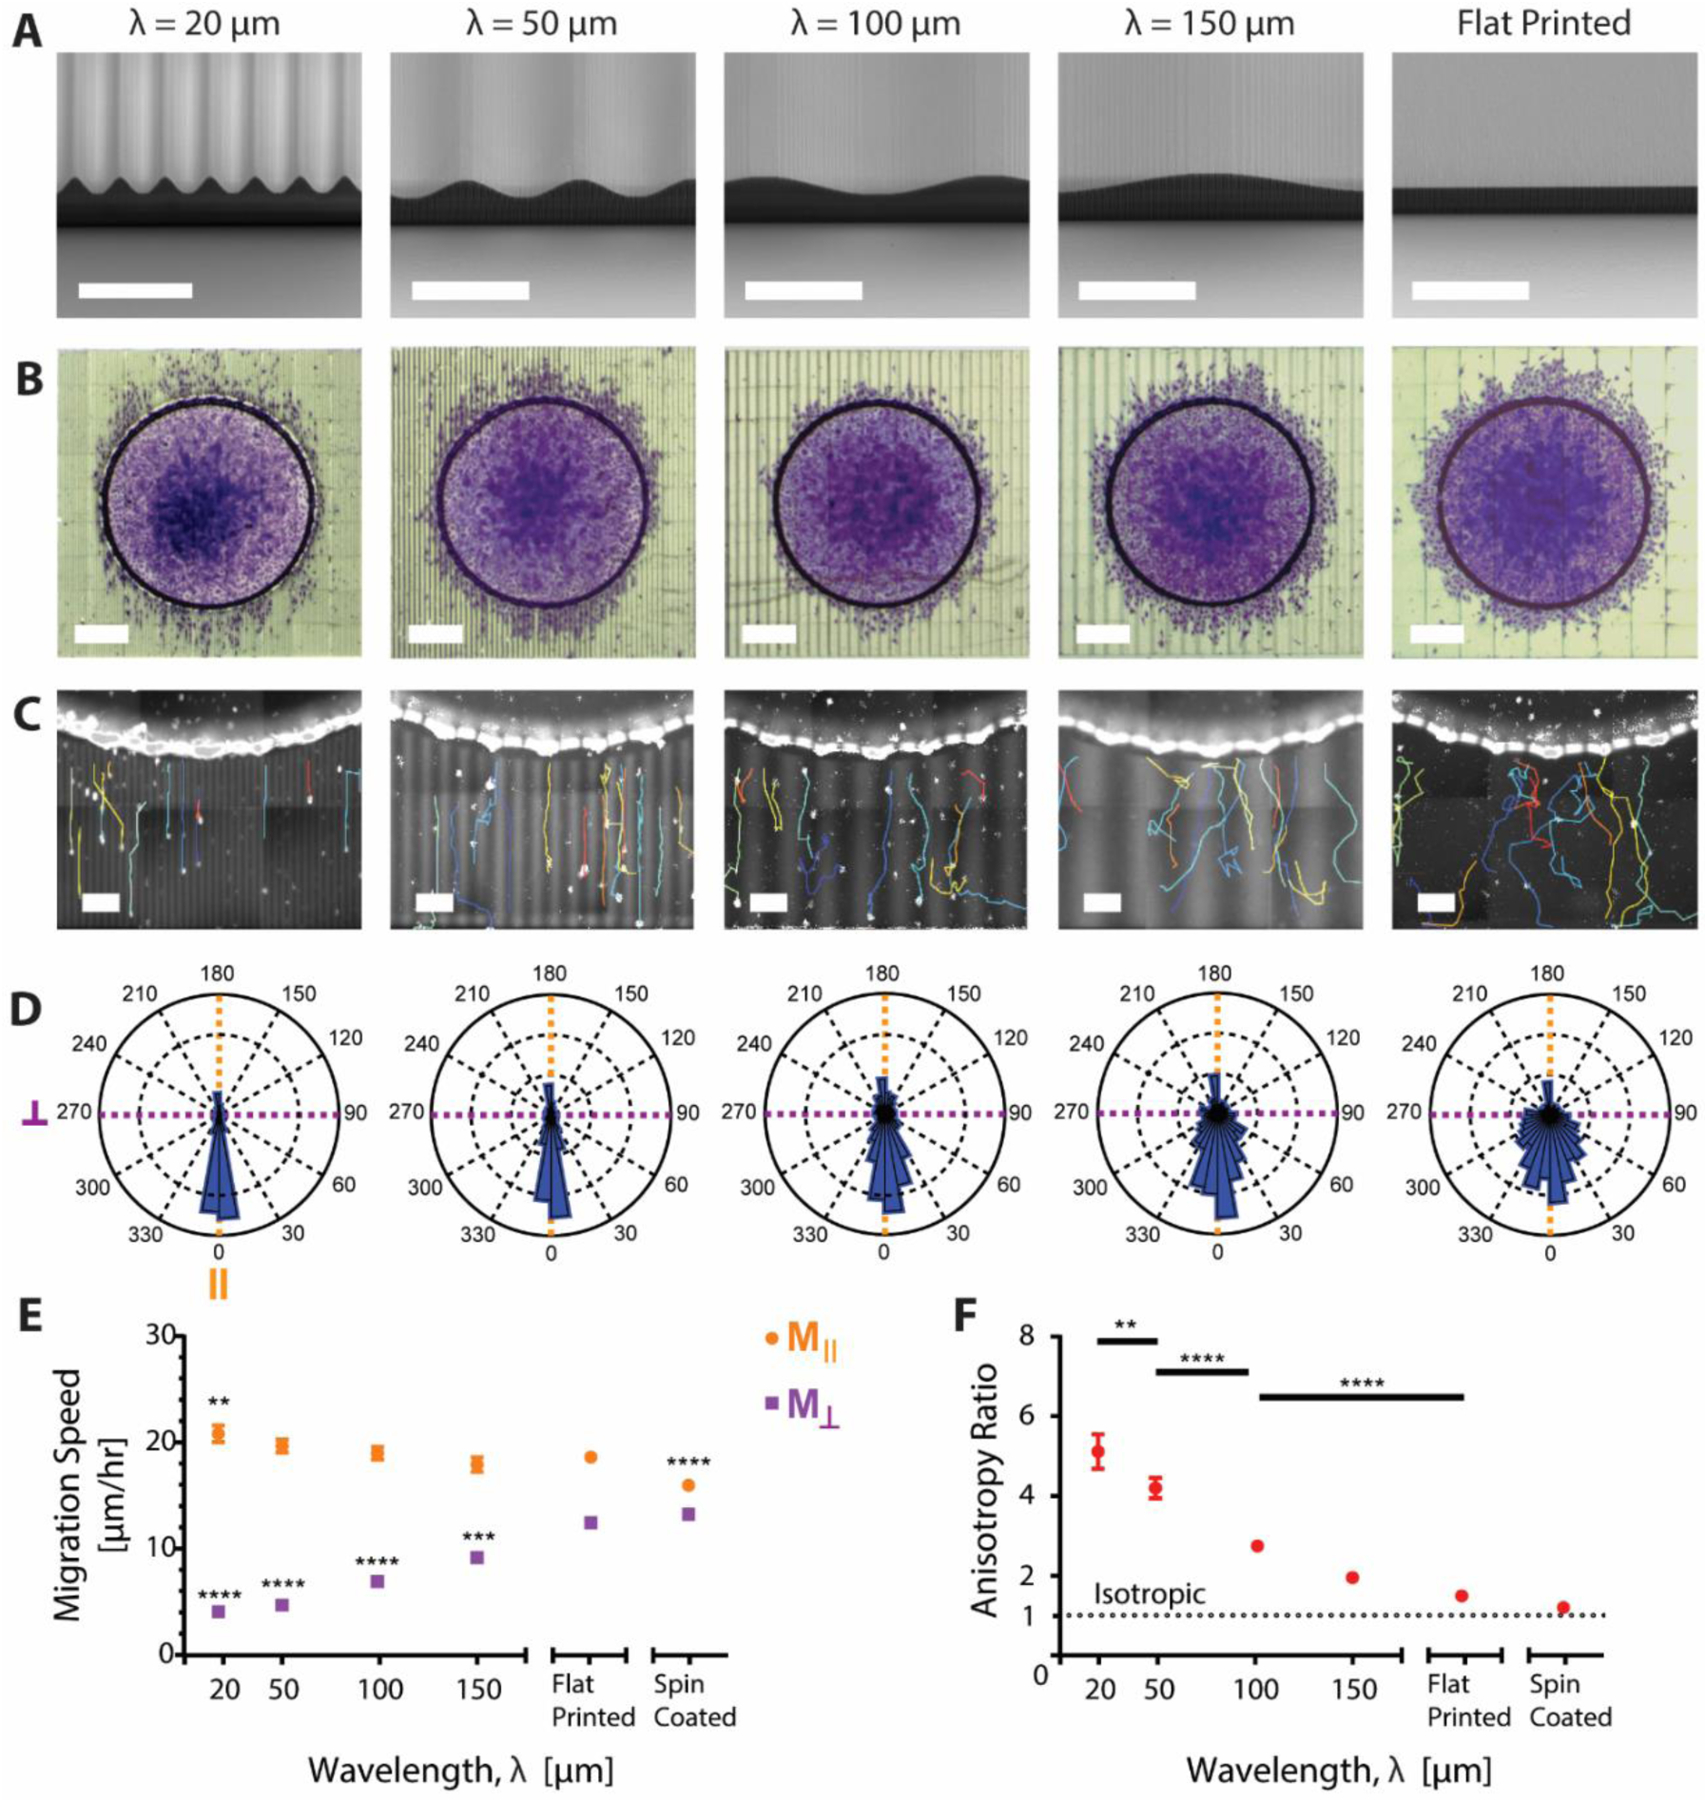
Figure 2:

A) SEM images of sine-wave topography prints with varying wavelength. Scale bar, 50 μm. B) Optical images of the cell migration front on the varied wavelength (λ) sine waves. Cells were fixed and stained with crystal violet. Scale bar, 300 μm. C) Representative single cell tracks output from Trackmate overlaid onto an image of H2B-RFP tagged cell nuclei. Printed patterns are autofluorescent and thus visible along with cell nuclei. Higher intensity areas denote the peaks of the sine waves while lower intensity areas denote the troughs. Scale bar, 50 μm. D) Rose plot histograms of the angle of cell migration over one-hour time intervals for each wavelength. Angle of migration was rotated so that the initial direction of migration out of the walls was in the 0° direction. Each plot shows combined data with n=8. E) Mǁ (orange) and M⊥ (purple) cell migration speed with varying wavelength. * indicates significance as compared to the flat printed condition. F) Migration speed anisotropy ratio: the ratio of Mǁ / M⊥ migration across the various wavelengths. An anisotropy ratio of 1 indicates isotropic migration. *, **, ***, or **** indicate p-value less than 0.05, 0.01, 0.001, and 0.0001 respectively. All error bars represent mean ± SEM.
