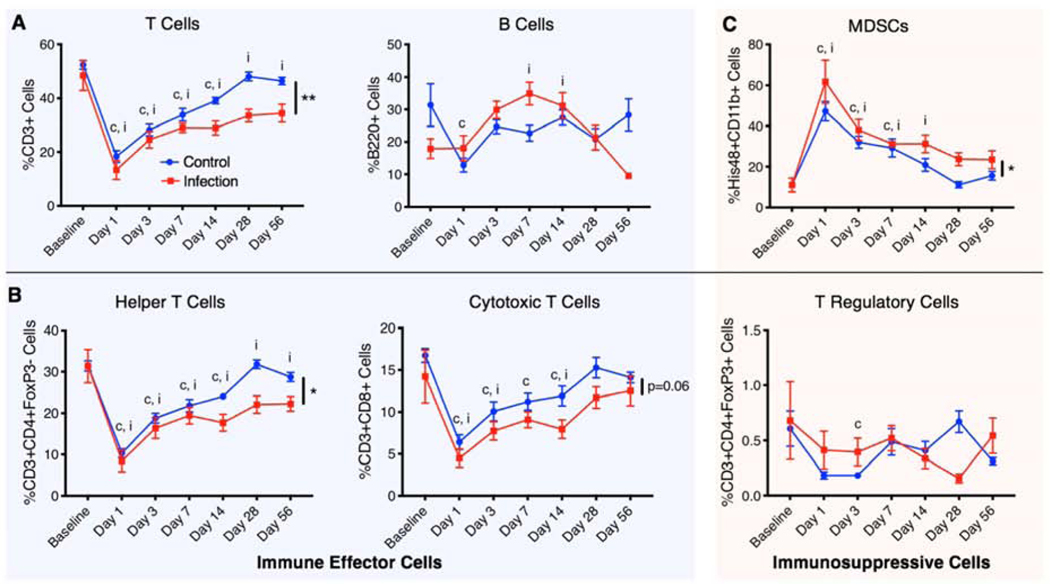
Figure 2. Local infection alters systemic immune cell populations.
Longitudinal analysis of immune cells circulating in the blood including A) lymphocytes (T cells and B cells), B) T cell subsets that include helper T cells, cytotoxic T cells, and T regulatory cells, and C) immunosuppressive MDSCs. These cell types are divided into immune effector cells (T cells, B cells, helper T cells, and cytotoxic T cells) and immunosuppressive cells (MDSCs and T regulatory cells). Overall differences between groups are indicated with a line and the p value or by a ** (p<0.01) or * (p<0.05). Significant differences (p<0.05) from the baseline in the control group and the infection group at specific timepoints are indicated with a “c” and an “i,” respectively. P values were determined by fitting a mixed-effects model (REML) with Sidak’s multiple comparisons test, an analysis similar to repeated measures 2-way ANOVA that can handle missing data points.

