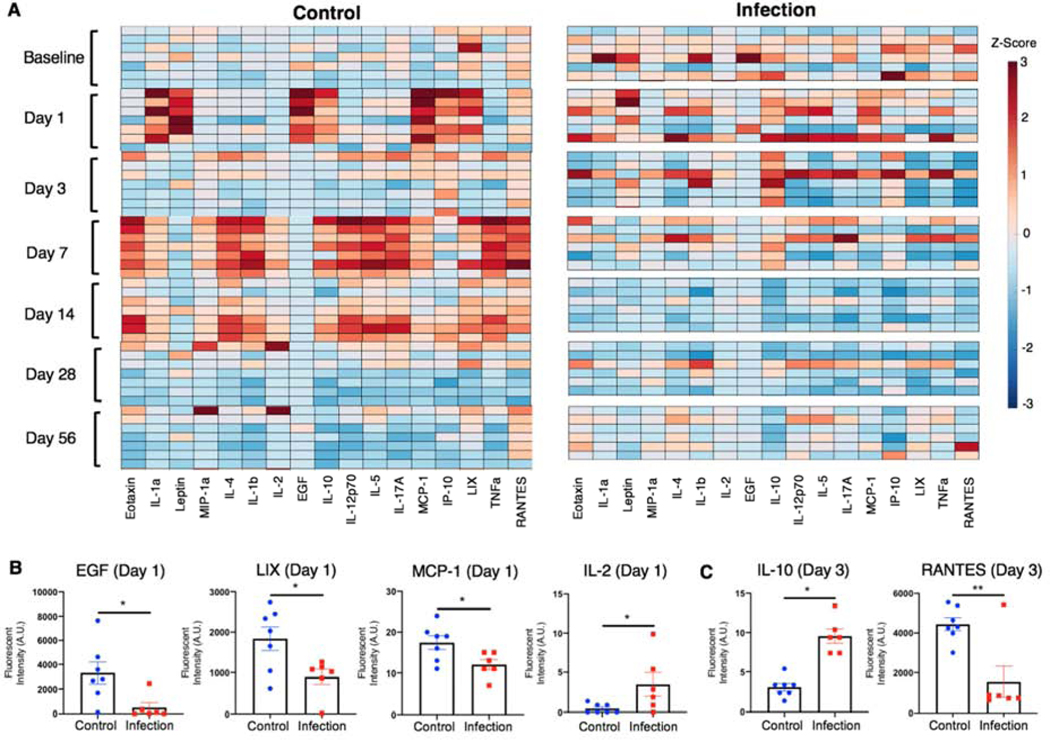
Figure 4. Local infection alters cytokine and chemokine profiles.
A) Heat map of z-scored cytokine levels (each column represents a different cytokine) in the control group (n=7, one n per row) and the infection group (n=6, one n per row) prior to surgery (Baseline) and at Days 1, 3, 7, 14, 28, and 56 post-surgery. Cytokine levels at the two earliest time points that exhibited significant differences between groups are shown for B) Day 1 and C) Day 3. Significance was determined using Student’s t-test or with Mann-Whitney test for non-parametric data with p<0.05 (*) and p<0.01 (**).

